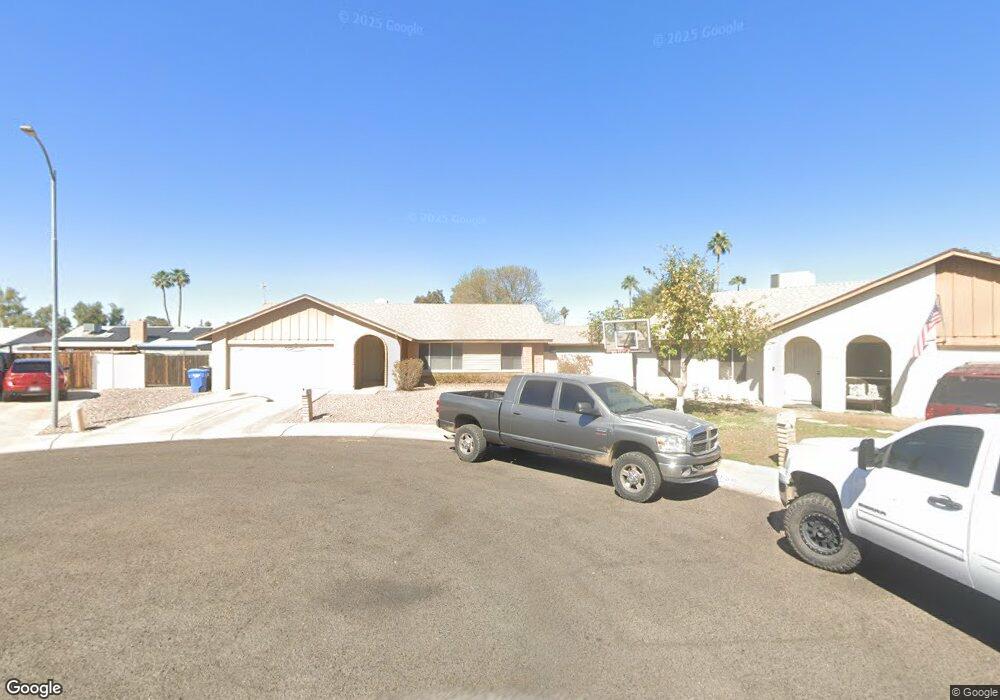
17641 N 34th Dr Phoenix, AZ 85053
Deer Valley NeighborhoodEstimated Value: $364,947 - $433,000
Studio
2
Baths
1,731
Sq Ft
$236/Sq Ft
Est. Value
About This Home
This home is located at 17641 N 34th Dr, Phoenix, AZ 85053 and is currently estimated at $408,487, approximately $235 per square foot. 17641 N 34th Dr is a home located in Maricopa County with nearby schools including Sunrise Elementary School, Desert Sky Middle School, and Deer Valley High School.
Ownership History
Date
Name
Owned For
Owner Type
Purchase Details
Closed on
Dec 7, 2020
Sold by
Jacobs Tiffany S
Bought by
Jacobs Tiffany S and The Tsj11 Living Trust
Current Estimated Value
Purchase Details
Closed on
Dec 23, 2009
Sold by
Jacobs Raymond C and Jacobs Cynthia S
Bought by
Jacobs Tiffany S
Purchase Details
Closed on
Aug 6, 2009
Sold by
Jacobs Raymond C and Jacobs Cynthia S
Bought by
Jacobs Raymond C and Jacobs Cynthia S
Purchase Details
Closed on
Dec 18, 2004
Sold by
Jacobs Tiffany S
Bought by
Jacobs Raymond C and Jacobs Cynthia S
Home Financials for this Owner
Home Financials are based on the most recent Mortgage that was taken out on this home.
Original Mortgage
$131,500
Outstanding Balance
$65,987
Interest Rate
5.76%
Mortgage Type
New Conventional
Estimated Equity
$342,500
Purchase Details
Closed on
Dec 18, 2000
Sold by
Wegner Michael A and Wegner Debra J
Bought by
Jacobs Tiffany S and Jacobs Raymond C
Home Financials for this Owner
Home Financials are based on the most recent Mortgage that was taken out on this home.
Original Mortgage
$124,808
Interest Rate
7.71%
Mortgage Type
FHA
Create a Home Valuation Report for This Property
The Home Valuation Report is an in-depth analysis detailing your home's value as well as a comparison with similar homes in the area
Home Values in the Area
Average Home Value in this Area
Purchase History
| Date | Buyer | Sale Price | Title Company |
|---|---|---|---|
| Jacobs Tiffany S | -- | None Available | |
| Jacobs Tiffany S | -- | None Available | |
| Jacobs Raymond C | -- | None Available | |
| Jacobs Raymond C | -- | Fidelity National Title | |
| Jacobs Tiffany S | -- | Grand Canyon Title Agency In |
Source: Public Records
Mortgage History
| Date | Status | Borrower | Loan Amount |
|---|---|---|---|
| Open | Jacobs Raymond C | $131,500 | |
| Closed | Jacobs Tiffany S | $124,808 |
Source: Public Records
Tax History
| Year | Tax Paid | Tax Assessment Tax Assessment Total Assessment is a certain percentage of the fair market value that is determined by local assessors to be the total taxable value of land and additions on the property. | Land | Improvement |
|---|---|---|---|---|
| 2025 | $1,857 | $18,110 | -- | -- |
| 2024 | $1,804 | $17,247 | -- | -- |
| 2023 | $1,804 | $31,900 | $6,380 | $25,520 |
| 2022 | $1,744 | $24,770 | $4,950 | $19,820 |
| 2021 | $1,790 | $22,670 | $4,530 | $18,140 |
| 2020 | $1,759 | $20,970 | $4,190 | $16,780 |
| 2019 | $1,708 | $20,010 | $4,000 | $16,010 |
| 2018 | $1,654 | $18,400 | $3,680 | $14,720 |
| 2017 | $1,601 | $15,960 | $3,190 | $12,770 |
| 2016 | $1,519 | $15,360 | $3,070 | $12,290 |
| 2015 | $1,055 | $12,950 | $2,590 | $10,360 |
Source: Public Records
Map
Nearby Homes
- 17641 N 34th Ln
- 17848 N 34th Ln
- 17853 N 35th Ave
- 3228 W Muriel Dr
- 3434 W Danbury Dr Unit 103
- 18212 N 34th Ln
- 3426 W Juniper Ave
- 3810 W Campo Bello Dr
- 17036 N 38th Ave
- 18426 N 36th Dr
- 2936 W Michelle Dr
- 3901 W Angela Dr
- 3024 W Wagoner Rd
- 3942 W Muriel Dr
- 2846 W Villa Rita Dr
- 3514 W Morrow Dr
- 3401 W Morrow Dr Unit 5
- 16412 N 33rd Ave
- 4007 W Anderson Dr
- 3525 W Kings Ave
- 17635 N 34th Dr
- 3411 W Saint John Rd
- 3407 W Saint John Rd
- 17640 N 34th Dr
- 3417 W Saint John Rd
- 17629 N 34th Dr
- 17640 N 34th Ave
- 17634 N 34th Dr
- 17646 N 34th Ave
- 17634 N 34th Ave
- 3423 W Saint John Rd
- 17628 N 34th Ave
- 17628 N 34th Dr
- 3412 W Saint John Rd
- 17637 N 34th Ln
- 3408 W Saint John Rd
- 3418 W Saint John Rd
- 3429 W Saint John Rd
- 3402 W Saint John Rd
- 3424 W Saint John Rd
Your Personal Tour Guide
Ask me questions while you tour the home.