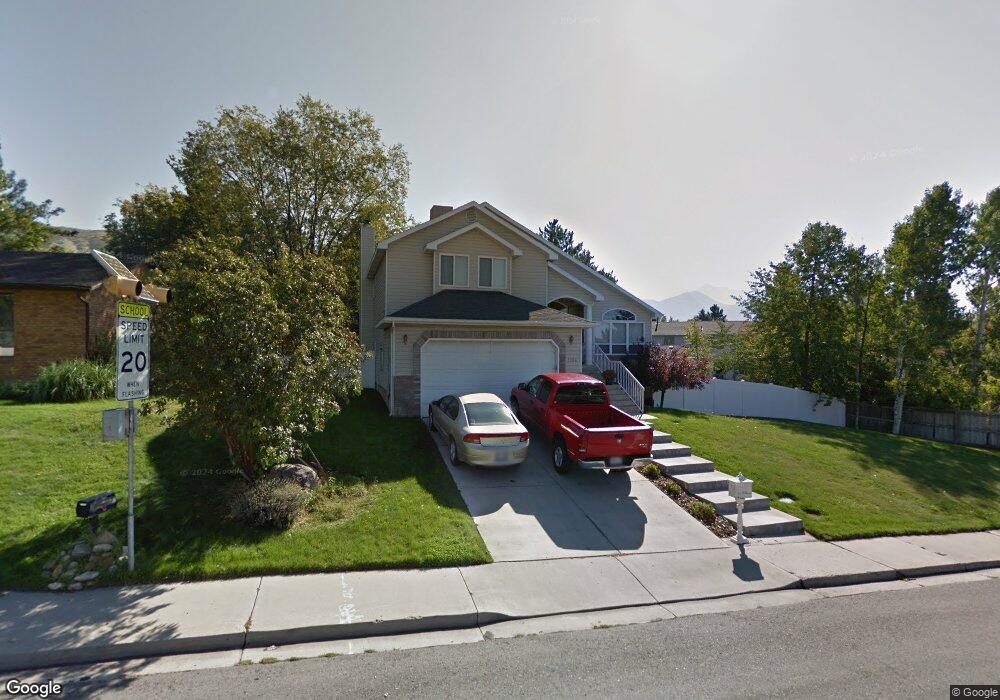
1766 N 400 E Orem, UT 84097
Northridge NeighborhoodEstimated Value: $587,000 - $606,792
3
Beds
3
Baths
1,859
Sq Ft
$323/Sq Ft
Est. Value
About This Home
This home is located at 1766 N 400 E, Orem, UT 84097 and is currently estimated at $599,931, approximately $322 per square foot. 1766 N 400 E is a home located in Utah County with nearby schools including Northridge Elementary School, Oak Canyon Junior High School, and Timpanogos High School.
Ownership History
Date
Name
Owned For
Owner Type
Purchase Details
Closed on
May 14, 2008
Sold by
Lamoreaux Russell S
Bought by
Lamoreaux Russell S and Lamoreaux Ellenora J
Current Estimated Value
Purchase Details
Closed on
Sep 16, 2005
Sold by
Thayne Douglas S
Bought by
Lamoreaux Russell S
Home Financials for this Owner
Home Financials are based on the most recent Mortgage that was taken out on this home.
Original Mortgage
$20,200
Interest Rate
5.72%
Mortgage Type
Stand Alone Second
Purchase Details
Closed on
Feb 12, 2003
Sold by
Done Brent R and Done Susan L
Bought by
Montoya James and Montoya Felila
Create a Home Valuation Report for This Property
The Home Valuation Report is an in-depth analysis detailing your home's value as well as a comparison with similar homes in the area
Home Values in the Area
Average Home Value in this Area
Purchase History
| Date | Buyer | Sale Price | Title Company |
|---|---|---|---|
| Lamoreaux Russell S | -- | Mountain View Title Orem | |
| Lamoreaux Russell S | -- | First American Title Agency | |
| Montoya James | -- | Title West Title Co |
Source: Public Records
Mortgage History
| Date | Status | Borrower | Loan Amount |
|---|---|---|---|
| Closed | Lamoreaux Russell S | $20,200 | |
| Open | Lamoreaux Russell S | $161,600 |
Source: Public Records
Tax History
| Year | Tax Paid | Tax Assessment Tax Assessment Total Assessment is a certain percentage of the fair market value that is determined by local assessors to be the total taxable value of land and additions on the property. | Land | Improvement |
|---|---|---|---|---|
| 2025 | $2,328 | $304,095 | -- | -- |
| 2024 | $2,328 | $284,680 | $0 | $0 |
| 2023 | $2,199 | $288,970 | $0 | $0 |
| 2022 | $2,264 | $288,200 | $0 | $0 |
| 2021 | $2,003 | $386,300 | $157,400 | $228,900 |
| 2020 | $1,848 | $350,300 | $125,900 | $224,400 |
| 2019 | $1,630 | $321,300 | $125,900 | $195,400 |
| 2018 | $1,577 | $297,000 | $118,700 | $178,300 |
| 2017 | $1,378 | $138,985 | $0 | $0 |
| 2016 | $1,486 | $138,215 | $0 | $0 |
| 2015 | $1,484 | $130,515 | $0 | $0 |
| 2014 | $1,354 | $118,580 | $0 | $0 |
Source: Public Records
Map
Nearby Homes
- 193 E 1570 N
- 363 E 1395 N Unit 22
- 1643 N Mountain Oaks Dr
- 1371 N 330 E Unit 8
- 713 E 1500 St N Unit 19
- 713 E 1450 N Unit 23
- 87 W 1525 N
- 1366 N 750 E Unit LOT 12
- 733 E 1450 N Unit 5
- 1356 N 750 E Unit 11
- 1051 E 100 N
- 1324 N 750 E Unit 3
- 372 E 1165 N
- 1547 N 275 West St Unit 5
- 687 E 175 N
- 332 W Amiron Way Unit D
- 1987 N 400 W
- 1461 N Amiron Way Unit D
- 1461 N Amiron Way Unit B
- 127 S 400 E
Your Personal Tour Guide
Ask me questions while you tour the home.