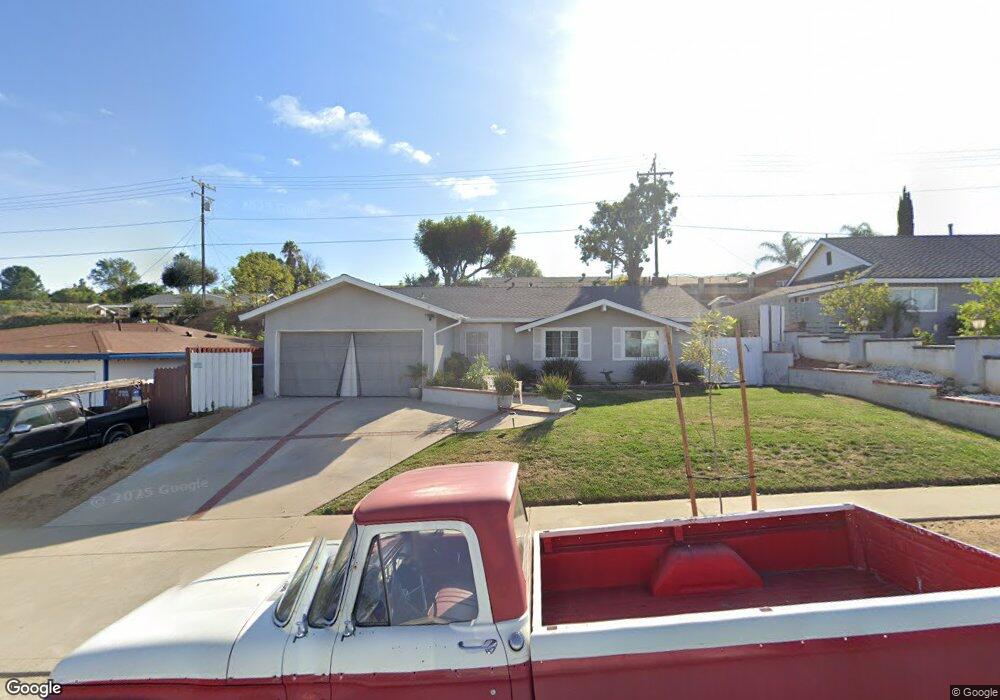
1768 Outpost Dr Corona, CA 92882
Central Corona NeighborhoodEstimated Value: $664,342 - $726,000
4
Beds
2
Baths
1,440
Sq Ft
$488/Sq Ft
Est. Value
About This Home
This home is located at 1768 Outpost Dr, Corona, CA 92882 and is currently estimated at $703,086, approximately $488 per square foot. 1768 Outpost Dr is a home located in Riverside County with nearby schools including John Adams Elementary School, Letha Raney Intermediate School, and Corona High School.
Ownership History
Date
Name
Owned For
Owner Type
Purchase Details
Closed on
Dec 23, 2009
Sold by
Rossel Judy Marie and Holman Michael Scott
Bought by
Holman Michael Scott and Holman Tamara Lee
Current Estimated Value
Purchase Details
Closed on
Jul 13, 2007
Sold by
Rossel Judy Marie and Holman Michael Scott
Bought by
Rossel Judy Marie and Holman Michael Scott
Home Financials for this Owner
Home Financials are based on the most recent Mortgage that was taken out on this home.
Original Mortgage
$80,000
Interest Rate
6.66%
Mortgage Type
Credit Line Revolving
Purchase Details
Closed on
Jan 12, 2006
Sold by
Rossel Judy Marie and Rossel Tamara Lee
Bought by
Rossel Judy Marie and Rossel Tamara Lee
Home Financials for this Owner
Home Financials are based on the most recent Mortgage that was taken out on this home.
Original Mortgage
$265,000
Interest Rate
6.28%
Mortgage Type
New Conventional
Purchase Details
Closed on
Sep 24, 2004
Sold by
Rossel Judy Marie
Bought by
Rossel Judy Marie and Rossel Tamara Lee
Create a Home Valuation Report for This Property
The Home Valuation Report is an in-depth analysis detailing your home's value as well as a comparison with similar homes in the area
Home Values in the Area
Average Home Value in this Area
Purchase History
| Date | Buyer | Sale Price | Title Company |
|---|---|---|---|
| Holman Michael Scott | -- | None Available | |
| Rossel Judy Marie | -- | Custom Title Solutions | |
| Rossel Judy Marie | -- | First American Title Company | |
| Rossel Judy Marie | -- | First American Title Co |
Source: Public Records
Mortgage History
| Date | Status | Borrower | Loan Amount |
|---|---|---|---|
| Closed | Rossel Judy Marie | $80,000 | |
| Closed | Rossel Judy Marie | $265,000 |
Source: Public Records
Tax History
| Year | Tax Paid | Tax Assessment Tax Assessment Total Assessment is a certain percentage of the fair market value that is determined by local assessors to be the total taxable value of land and additions on the property. | Land | Improvement |
|---|---|---|---|---|
| 2025 | $1,913 | $177,182 | $51,747 | $125,435 |
| 2023 | $1,913 | $170,304 | $49,739 | $120,565 |
| 2022 | $1,851 | $166,965 | $48,764 | $118,201 |
| 2021 | $1,813 | $163,692 | $47,808 | $115,884 |
| 2020 | $1,792 | $162,014 | $47,318 | $114,696 |
| 2019 | $1,750 | $158,839 | $46,391 | $112,448 |
| 2018 | $1,711 | $155,726 | $45,483 | $110,243 |
| 2017 | $1,668 | $152,674 | $44,592 | $108,082 |
| 2016 | $1,651 | $149,681 | $43,718 | $105,963 |
| 2015 | $1,614 | $147,434 | $43,062 | $104,372 |
| 2014 | $1,556 | $144,548 | $42,219 | $102,329 |
Source: Public Records
Map
Nearby Homes
- 1764 Coplen Cir
- 1546 Tilson Cir
- 2313 Mesquite Ln
- 2443 Emerson Cir
- 1720 Sugar Pine Dr
- 1751 Moccasin Trail Cir
- 2416 Patriot Way
- 1598 Border Ave Unit H
- 1320 Brentwood Cir Unit B
- 2576 Avenida Del Vista Unit L204
- 1554 Border Ave Unit G
- 2442 Antelope Dr
- 2598 Independence Way
- 2588 Avenida Del Vista Unit 204
- 1305 Brentwood Cir Unit D
- 2600 Avenida Del Vista Unit F203
- 2608 Avenida Del Vista
- 2612 Avenida Del Vista
- 2421 Mangular Ave
- 2616 Avenida Del Vista Unit 104
- 1776 Outpost Dr
- 1756 Outpost Dr
- 1765 W Ontario Ave
- 1755 W Ontario Ave
- 1788 Outpost Dr
- 1748 Outpost Dr
- 1775 W Ontario Ave
- 1761 Outpost Dr
- 1745 W Ontario Ave
- 1775 Outpost Dr
- 1785 W Ontario Ave
- 1736 Outpost Dr
- 1783 Outpost Dr
- 1735 W Ontario Ave
- 2293 Longview Dr
- 2280 Longview Dr
- 2281 Avenida Del Vista
- 1728 Outpost Dr
- 1725 W Ontario Ave
- 2298 Avenida Del Vista
Your Personal Tour Guide
Ask me questions while you tour the home.