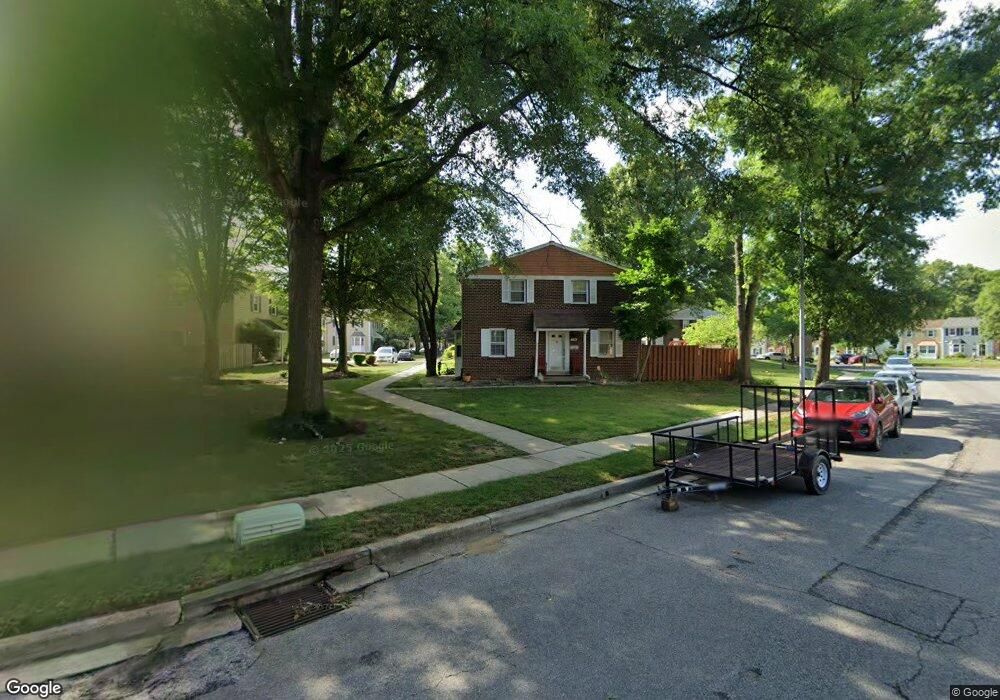
1769 Castleford Square Crofton, MD 21114
Estimated Value: $382,000 - $405,000
--
Bed
2
Baths
1,216
Sq Ft
$323/Sq Ft
Est. Value
About This Home
This home is located at 1769 Castleford Square, Crofton, MD 21114 and is currently estimated at $393,216, approximately $323 per square foot. 1769 Castleford Square is a home located in Anne Arundel County with nearby schools including Crofton Meadows Elementary School, Crofton Middle School, and Crofton High School.
Ownership History
Date
Name
Owned For
Owner Type
Purchase Details
Closed on
Jun 14, 2024
Sold by
Fancovic Jason R
Bought by
Brookman Taylor M and Leonard Kyle J
Current Estimated Value
Home Financials for this Owner
Home Financials are based on the most recent Mortgage that was taken out on this home.
Original Mortgage
$363,298
Outstanding Balance
$358,671
Interest Rate
7.03%
Mortgage Type
FHA
Estimated Equity
$34,545
Purchase Details
Closed on
Jun 28, 2013
Sold by
Tighe Catherine
Bought by
Fancovic Jason R
Home Financials for this Owner
Home Financials are based on the most recent Mortgage that was taken out on this home.
Original Mortgage
$178,703
Interest Rate
3.83%
Mortgage Type
FHA
Purchase Details
Closed on
Aug 1, 2005
Sold by
Oaks Thomas H
Bought by
Tighe Catherine
Purchase Details
Closed on
Nov 27, 2002
Sold by
Oaks George E
Bought by
Oaks Thomas H
Create a Home Valuation Report for This Property
The Home Valuation Report is an in-depth analysis detailing your home's value as well as a comparison with similar homes in the area
Home Values in the Area
Average Home Value in this Area
Purchase History
| Date | Buyer | Sale Price | Title Company |
|---|---|---|---|
| Brookman Taylor M | $370,000 | First Equity Title | |
| Brookman Taylor M | $370,000 | First Equity Title | |
| Fancovic Jason R | $182,000 | Lakeside Title Company | |
| Tighe Catherine | $255,000 | -- | |
| Oaks Thomas H | $126,900 | -- |
Source: Public Records
Mortgage History
| Date | Status | Borrower | Loan Amount |
|---|---|---|---|
| Open | Brookman Taylor M | $363,298 | |
| Closed | Brookman Taylor M | $363,298 | |
| Previous Owner | Fancovic Jason R | $178,703 | |
| Closed | Oaks Thomas H | -- |
Source: Public Records
Tax History Compared to Growth
Tax History
| Year | Tax Paid | Tax Assessment Tax Assessment Total Assessment is a certain percentage of the fair market value that is determined by local assessors to be the total taxable value of land and additions on the property. | Land | Improvement |
|---|---|---|---|---|
| 2025 | $3,416 | $292,433 | -- | -- |
| 2024 | $3,416 | $271,467 | $0 | $0 |
| 2023 | $2,735 | $250,500 | $135,000 | $115,500 |
| 2022 | $2,581 | $247,033 | $0 | $0 |
| 2021 | $5,844 | $243,567 | $0 | $0 |
| 2020 | $5,690 | $240,100 | $120,000 | $120,100 |
| 2019 | $5,546 | $237,567 | $0 | $0 |
| 2018 | $2,383 | $235,033 | $0 | $0 |
| 2017 | $2,614 | $232,500 | $0 | $0 |
| 2016 | -- | $222,167 | $0 | $0 |
| 2015 | -- | $211,833 | $0 | $0 |
| 2014 | -- | $201,500 | $0 | $0 |
Source: Public Records
Map
Nearby Homes
- 1822 Foxdale Ct
- 1711 Denton Ct
- 1745 Leisure Way
- 1721 Leisure Way
- 1804 Aberdeen Cir
- 1802 Harewood Ln
- 1740 Jones Falls Ct
- 1923 Everglade Ct
- 1619 New Windsor Ct
- 2564 Log Mill Ct
- 2110 Sandy Ct
- 1904 Ardenwood Terrace
- 1636 New Windsor Ct
- 1914 Ardenwood Terrace
- 2241 Aberdeen Dr
- 2510 Log Mill Ct
- 2807 Klein Ct
- 2808 Klein Ct
- 1701 Underwood Rd
- 1403 Knights Bridge Turn
- 1769 Castleford Square Unit 124
- 1771 Castleford Square
- 1771 Castleford Square Unit 125
- 1831 Foxdale Ct
- 1773 Castleford Square
- 1847 Foxdale Ct Unit 117
- 1847 Foxdale Ct
- 1772 Castleford Square
- 1849 Foxdale Ct
- 1827 Foxdale Ct
- 1827 Foxdale Ct Unit 143
- 1765 Castleford Square
- 1851 Foxdale Ct
- 1853 Foxdale Ct
- 1825 Foxdale Ct
- 1825 Foxdale Ct Unit 144
- 1770 Castleford Square Unit 160
- 1770 Castleford Square
- 1763 Castleford Square
- 1855 Foxdale Ct