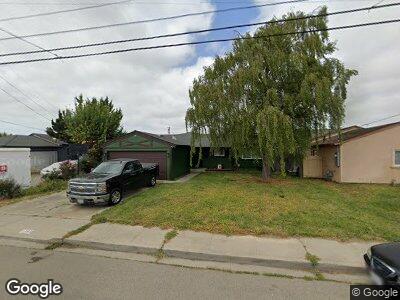
1769 Via Chorro San Lorenzo, CA 94580
Estimated Value: $879,000 - $900,000
3
Beds
2
Baths
1,287
Sq Ft
$693/Sq Ft
Est. Value
About This Home
This home is located at 1769 Via Chorro, San Lorenzo, CA 94580 and is currently estimated at $891,851, approximately $692 per square foot. 1769 Via Chorro is a home located in Alameda County with nearby schools including Bay Elementary School, Washington Manor Middle School, and Arroyo High School.
Ownership History
Date
Name
Owned For
Owner Type
Purchase Details
Closed on
Sep 7, 2012
Sold by
Blaurock John E
Bought by
Blaurock John E and Blaurock Shawna Michelle
Current Estimated Value
Home Financials for this Owner
Home Financials are based on the most recent Mortgage that was taken out on this home.
Original Mortgage
$413,620
Outstanding Balance
$296,052
Interest Rate
3.63%
Mortgage Type
New Conventional
Estimated Equity
$531,839
Purchase Details
Closed on
Jun 13, 2003
Sold by
Blaurock Jannette
Bought by
Blaurock John E
Home Financials for this Owner
Home Financials are based on the most recent Mortgage that was taken out on this home.
Original Mortgage
$292,000
Interest Rate
5.53%
Mortgage Type
Purchase Money Mortgage
Purchase Details
Closed on
Oct 8, 1993
Sold by
Savage Herbert R and Savage Virginia L
Bought by
Savage Herbert R and Savage Virginia L
Create a Home Valuation Report for This Property
The Home Valuation Report is an in-depth analysis detailing your home's value as well as a comparison with similar homes in the area
Home Values in the Area
Average Home Value in this Area
Purchase History
| Date | Buyer | Sale Price | Title Company |
|---|---|---|---|
| Blaurock John E | -- | First American Title Ins Co | |
| Blaurock John E | -- | Fidelity National Title Co | |
| Blaurock John E | $365,000 | Fidelity National Title Co | |
| Savage Herbert R | -- | -- |
Source: Public Records
Mortgage History
| Date | Status | Borrower | Loan Amount |
|---|---|---|---|
| Open | Blaurock John E | $25,000 | |
| Open | Blaurock John E | $413,620 | |
| Closed | Blaurock John E | $406,000 | |
| Closed | Blaurock John E | $292,000 | |
| Closed | Blaurock John E | $36,500 |
Source: Public Records
Tax History Compared to Growth
Tax History
| Year | Tax Paid | Tax Assessment Tax Assessment Total Assessment is a certain percentage of the fair market value that is determined by local assessors to be the total taxable value of land and additions on the property. | Land | Improvement |
|---|---|---|---|---|
| 2024 | $6,948 | $518,230 | $155,469 | $362,761 |
| 2023 | $6,915 | $508,071 | $152,421 | $355,650 |
| 2022 | $6,814 | $498,111 | $149,433 | $348,678 |
| 2021 | $6,628 | $488,347 | $146,504 | $341,843 |
| 2020 | $6,486 | $483,343 | $145,003 | $338,340 |
| 2019 | $6,496 | $473,867 | $142,160 | $331,707 |
| 2018 | $6,140 | $464,578 | $139,373 | $325,205 |
| 2017 | $5,861 | $455,471 | $136,641 | $318,830 |
| 2016 | $5,593 | $446,544 | $133,963 | $312,581 |
| 2015 | $5,472 | $439,838 | $131,951 | $307,887 |
| 2014 | $5,392 | $431,224 | $129,367 | $301,857 |
Source: Public Records
Map
Nearby Homes
- 1781 Via Rancho
- 1560 Vining Dr
- 1603 Via Lacqua
- 1943 Vining Dr
- 1958 Vining Dr
- 16087 Via Harriet
- 15373 Inverness St
- 1457 Via el Monte
- 1773 Keller Ave
- 1608 Lanier Ave
- 1599 Bandoni Ave
- 1802 Bandoni Ave
- 0 E 14th St Unit 41059501
- 1417 Via Manzanas
- 874 Lewelling Blvd
- 156 Santa Teresa
- 15204 Norton St
- 137 Santa Teresa
- 1723 Via Mesa
- 1769 Via Chorro
- 1785 Via Chorro
- 1753 Via Chorro
- 1758 Via Lobos
- 1737 Via Chorro
- 1782 Via Lobos
- 1742 Via Lobos
- 15756 Via Nueva
- 15748 Via Nueva
- 1770 Via Chorro
- 1726 Via Lobos
- 1754 Via Chorro
- 1786 Via Chorro
- 1721 Via Chorro
- 15740 Via Nueva
- 1738 Via Chorro
- 15770 Via Nueva
- 1710 Via Lobos
- 1705 Via Chorro
- 1722 Via Chorro