Estimated Value: $640,054 - $689,000
5
Beds
4
Baths
2,846
Sq Ft
$235/Sq Ft
Est. Value
About This Home
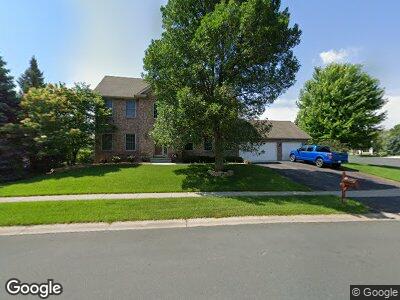
This home is located at 17693 93rd Place N, Osseo, MN 55311 and is currently estimated at $668,764, approximately $234 per square foot. 17693 93rd Place N is a home located in Hennepin County with nearby schools including Rush Creek Elementary School, Maple Grove Middle School, and Maple Grove Senior High School.
Ownership History
Date
Name
Owned For
Owner Type
Purchase Details
Closed on
Nov 4, 2011
Sold by
Scroggins Donn G and Scroggins Christine M
Bought by
Runkle Jason L and Runkle Angela M
Current Estimated Value
Home Financials for this Owner
Home Financials are based on the most recent Mortgage that was taken out on this home.
Original Mortgage
$396,150
Outstanding Balance
$275,041
Interest Rate
4.02%
Mortgage Type
New Conventional
Estimated Equity
$393,723
Purchase Details
Closed on
Feb 21, 2004
Sold by
Kukuk Anthony P and Kukuk Laura C
Bought by
Prudential Residential Services
Purchase Details
Closed on
Jul 18, 2000
Sold by
James C Peterson & Associates Inc
Bought by
Kukuk Anthony P and Kukuk Laura C
Purchase Details
Closed on
Sep 19, 1997
Sold by
Janco Inc
Bought by
James C Peterson & Associates Inc
Purchase Details
Closed on
Sep 17, 1997
Sold by
Janco Inc
Bought by
James C Peterson Associates Inc
Create a Home Valuation Report for This Property
The Home Valuation Report is an in-depth analysis detailing your home's value as well as a comparison with similar homes in the area
Home Values in the Area
Average Home Value in this Area
Purchase History
| Date | Buyer | Sale Price | Title Company |
|---|---|---|---|
| Runkle Jason L | $417,000 | Burnet Title | |
| Prudential Residential Services | $475,000 | -- | |
| Scroggins Donn G | $475,000 | -- | |
| Kukuk Anthony P | $345,900 | -- | |
| James C Peterson & Associates Inc | $65,000 | -- | |
| James C Peterson Associates Inc | $281,000 | -- |
Source: Public Records
Mortgage History
| Date | Status | Borrower | Loan Amount |
|---|---|---|---|
| Open | Runkle Jason L | $396,150 | |
| Previous Owner | Scroggins Donn G | $250,000 | |
| Closed | James C Peterson Associates Inc | -- |
Source: Public Records
Tax History Compared to Growth
Tax History
| Year | Tax Paid | Tax Assessment Tax Assessment Total Assessment is a certain percentage of the fair market value that is determined by local assessors to be the total taxable value of land and additions on the property. | Land | Improvement |
|---|---|---|---|---|
| 2023 | $7,622 | $625,300 | $145,300 | $480,000 |
| 2022 | $5,983 | $593,200 | $100,100 | $493,100 |
| 2021 | $5,590 | $493,000 | $82,800 | $410,200 |
| 2020 | $6,065 | $452,900 | $52,000 | $400,900 |
| 2019 | $6,144 | $466,600 | $72,000 | $394,600 |
| 2018 | $6,127 | $446,100 | $67,000 | $379,100 |
| 2017 | $6,330 | $432,200 | $81,000 | $351,200 |
| 2016 | $6,334 | $426,400 | $81,000 | $345,400 |
| 2015 | $6,335 | $414,800 | $86,000 | $328,800 |
| 2014 | -- | $391,200 | $86,000 | $305,200 |
Source: Public Records
Map
Nearby Homes
- 17606 93rd Place N
- 17520 93rd Place N
- 9209 Merrimac Ln N
- 9349 Kimberly Ln N
- 9640 Peony Ln N Unit 1208
- 9277 Inland Ln N
- 17156 93rd Place N Unit 56
- 18061 96th Ave N
- 18049 96th Ave N
- 9033 Peony Ln N
- 9063 Holly Ln N
- 9105 Holly Ln N
- 9670 Merrimac Ln N
- 10154 Peony Ln N
- 10172 Peony Ln N
- 17950 89th Place N
- 9179 Larkspur Glade
- 8947 Vandegriff Way
- 8924 Tewsbury Gate N
- 8782 Narcissus Ln N
- 17693 93rd Place N
- 9334 Narcissus Ln N
- 17671 93rd Place N
- 17702 93rd Place N
- 17670 93rd Place N
- 17649 93rd Place N
- 9312 Narcissus Ln N
- 17638 93rd Place N
- 17724 93rd Place N
- 9323 Narcissus Ln N
- 9311 Narcissus Ln N
- 9292 Merrimac Ln N
- 17627 93rd Place N
- 9288 Merrimac Ln N
- 9284 Merrimac Ln N
- 9280 Merrimac Ln N
- 17595 93rd Place N
- 17768 93rd Place N
- 9276 Merrimac Ln N
- 9272 Merrimac Ln N