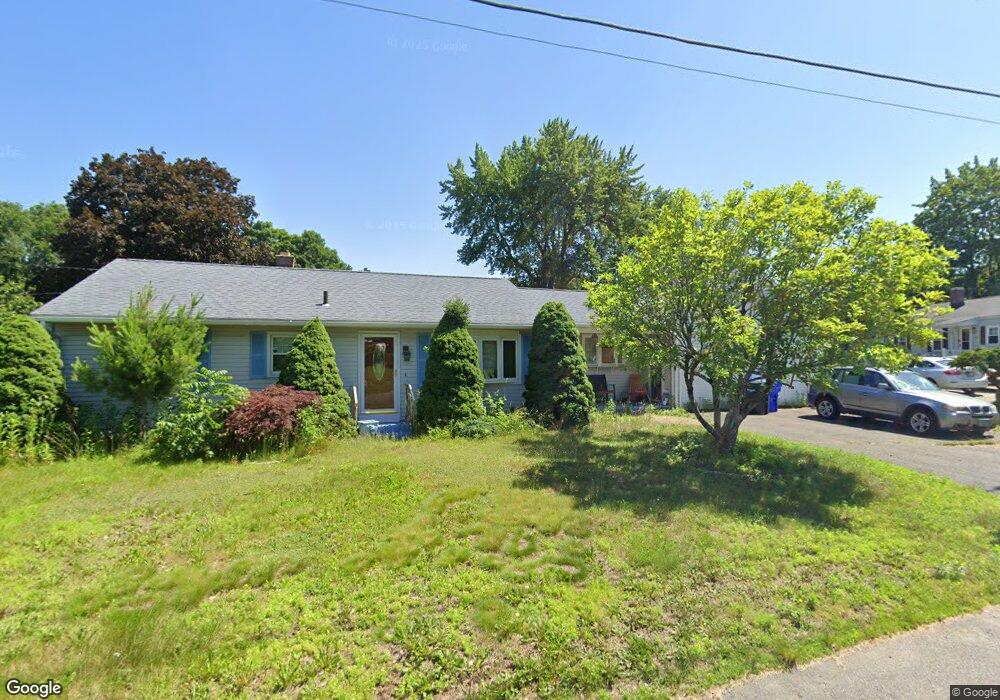
177 Flint St Springfield, MA 01129
Sixteen Acres NeighborhoodEstimated Value: $326,000 - $369,000
2
Beds
1
Bath
1,584
Sq Ft
$214/Sq Ft
Est. Value
About This Home
This home is located at 177 Flint St, Springfield, MA 01129 and is currently estimated at $338,323, approximately $213 per square foot. 177 Flint St is a home located in Hampden County with nearby schools including Warner, M Marcus Kiley Middle, and Springfield Central High School.
Ownership History
Date
Name
Owned For
Owner Type
Purchase Details
Closed on
Jan 7, 2026
Sold by
Burt Margo and Santander Bank
Bought by
Sr Homebuyers Llc
Current Estimated Value
Home Financials for this Owner
Home Financials are based on the most recent Mortgage that was taken out on this home.
Original Mortgage
$247,000
Outstanding Balance
$247,000
Interest Rate
6.23%
Mortgage Type
Commercial
Estimated Equity
$91,323
Create a Home Valuation Report for This Property
The Home Valuation Report is an in-depth analysis detailing your home's value as well as a comparison with similar homes in the area
Home Values in the Area
Average Home Value in this Area
Purchase History
| Date | Buyer | Sale Price | Title Company |
|---|---|---|---|
| Sr Homebuyers Llc | $182,000 | -- |
Source: Public Records
Mortgage History
| Date | Status | Borrower | Loan Amount |
|---|---|---|---|
| Open | Sr Homebuyers Llc | $247,000 |
Source: Public Records
Tax History
| Year | Tax Paid | Tax Assessment Tax Assessment Total Assessment is a certain percentage of the fair market value that is determined by local assessors to be the total taxable value of land and additions on the property. | Land | Improvement |
|---|---|---|---|---|
| 2025 | $4,963 | $316,500 | $58,700 | $257,800 |
| 2024 | $4,932 | $307,100 | $58,700 | $248,400 |
| 2023 | $4,387 | $257,300 | $55,900 | $201,400 |
| 2022 | $4,464 | $237,200 | $55,900 | $181,300 |
| 2021 | $4,326 | $228,900 | $50,800 | $178,100 |
| 2020 | $4,021 | $205,900 | $50,800 | $155,100 |
| 2019 | $3,769 | $191,500 | $50,800 | $140,700 |
| 2018 | $3,747 | $190,400 | $50,800 | $139,600 |
| 2017 | $3,608 | $183,500 | $45,800 | $137,700 |
| 2016 | $3,413 | $173,600 | $45,800 | $127,800 |
| 2015 | $3,375 | $171,600 | $45,800 | $125,800 |
Source: Public Records
Map
Nearby Homes
- 396 Hermitage Dr
- 6 Southern Rd
- 386 Hermitage Dr
- 405 Hermitage Dr
- 18 Southern Rd
- 188 Flint St
- 237 Marmon St
- 393 Hermitage Dr
- 238 Marmon St
- 238 Marmon St Unit 1
- 376 Hermitage Dr
- 7 Southern Rd
- 28 Southern Rd
- 229 Marmon St
- 158 Hermitage Dr
- 168 Hermitage Dr
- 148 Hermitage Dr
- 366 Hermitage Dr
- 25 Southern Rd
- 184 Hermitage Dr
Your Personal Tour Guide
Ask me questions while you tour the home.