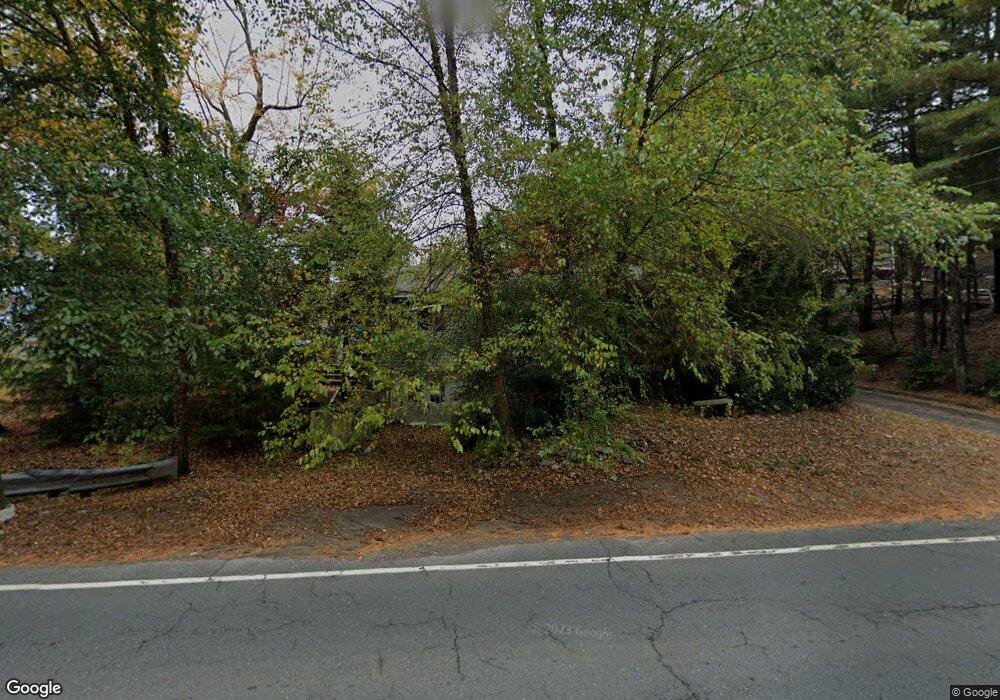
177 Sandy Beach Rd Ellington, CT 06029
Crystal Lake NeighborhoodEstimated Value: $266,000 - $321,000
3
Beds
1
Bath
1,360
Sq Ft
$218/Sq Ft
Est. Value
About This Home
This home is located at 177 Sandy Beach Rd, Ellington, CT 06029 and is currently estimated at $296,645, approximately $218 per square foot. 177 Sandy Beach Rd is a home located in Tolland County with nearby schools including Ellington High School.
Ownership History
Date
Name
Owned For
Owner Type
Purchase Details
Closed on
Dec 17, 2004
Sold by
Macfeat Michael and Macfeat Amber
Bought by
Czaja Stephen
Current Estimated Value
Home Financials for this Owner
Home Financials are based on the most recent Mortgage that was taken out on this home.
Original Mortgage
$119,920
Outstanding Balance
$66,594
Interest Rate
7.4%
Estimated Equity
$230,051
Purchase Details
Closed on
Aug 2, 2000
Sold by
Dubay Roland and Dubay Deborah
Bought by
Macfeat Michael and Macfeat Amber
Home Financials for this Owner
Home Financials are based on the most recent Mortgage that was taken out on this home.
Original Mortgage
$95,930
Interest Rate
8.1%
Purchase Details
Closed on
Jul 6, 1993
Sold by
Bloniarz Francis and Bloniarz Theresa
Bought by
Dubay Roland and Dubay Deborah
Home Financials for this Owner
Home Financials are based on the most recent Mortgage that was taken out on this home.
Original Mortgage
$90,650
Interest Rate
7.46%
Mortgage Type
Unknown
Purchase Details
Closed on
Aug 28, 1991
Sold by
Foust Kenneth and Foust Victoria
Bought by
Bloniarz Francis and Bloniarz Theresa
Create a Home Valuation Report for This Property
The Home Valuation Report is an in-depth analysis detailing your home's value as well as a comparison with similar homes in the area
Home Values in the Area
Average Home Value in this Area
Purchase History
| Date | Buyer | Sale Price | Title Company |
|---|---|---|---|
| Czaja Stephen | $149,900 | -- | |
| Macfeat Michael | $98,900 | -- | |
| Dubay Roland | $93,500 | -- | |
| Bloniarz Francis | $98,000 | -- |
Source: Public Records
Mortgage History
| Date | Status | Borrower | Loan Amount |
|---|---|---|---|
| Open | Bloniarz Francis | $119,920 | |
| Previous Owner | Bloniarz Francis | $95,930 | |
| Previous Owner | Bloniarz Francis | $90,650 |
Source: Public Records
Tax History Compared to Growth
Tax History
| Year | Tax Paid | Tax Assessment Tax Assessment Total Assessment is a certain percentage of the fair market value that is determined by local assessors to be the total taxable value of land and additions on the property. | Land | Improvement |
|---|---|---|---|---|
| 2025 | $4,537 | $122,280 | $50,230 | $72,050 |
| 2024 | $4,402 | $122,280 | $50,230 | $72,050 |
| 2023 | $4,194 | $122,280 | $50,230 | $72,050 |
| 2022 | $3,974 | $122,280 | $50,230 | $72,050 |
| 2021 | $3,864 | $122,280 | $50,230 | $72,050 |
| 2020 | $4,054 | $124,370 | $50,570 | $73,800 |
| 2019 | $4,054 | $124,370 | $50,570 | $73,800 |
| 2016 | $3,793 | $124,370 | $50,570 | $73,800 |
| 2015 | $3,728 | $122,240 | $50,570 | $71,670 |
| 2014 | $3,508 | $122,240 | $50,570 | $71,670 |
Source: Public Records
Map
Nearby Homes
- 26 Green St
- 127 Sandy Beach Rd
- 267 Sandy Beach Rd
- 100 Wildwood Rd
- 42 Ladd Rd
- 115 Conklin Rd
- 15 Usher Ridge
- 68 Usher Ridge
- 36 Usher Ridge
- 110 Neff Hill Rd
- 130 Neff Hill Rd
- 105 Neff Hill Rd
- 137 Neff Hill Rd
- 100 Neff Hill Rd
- 77 Neff Hill Rd
- 84 Neff Hill Rd
- 71 Neff Hill Rd
- 12 Burbank Rd
- 8 Neff Hill Rd
- 644 Buff Cap Rd
- 8 Aborn Private Rd
- 181 Sandy Beach Rd
- 2 Aborn Rd
- 8 Sandy Beach Rd
- 10 Aborn Private Rd
- 6 Aborn Rd
- 11 Aborn Private Rd
- 12 Aborn Private Rd
- 0 Crystal Ridge Dr Unit G498686
- 14 Aborn Private Rd
- 14 Aborn Rd
- 3 Aborn Rd
- 9 Aborn Rd
- 13 Aborn Rd
- 18 Aborn Rd
- 15 Aborn Rd
- 1 Crystal Ridge Dr
- 20 Aborn Rd
- 19 Aborn Rd
- 10 Minor Hill Rd