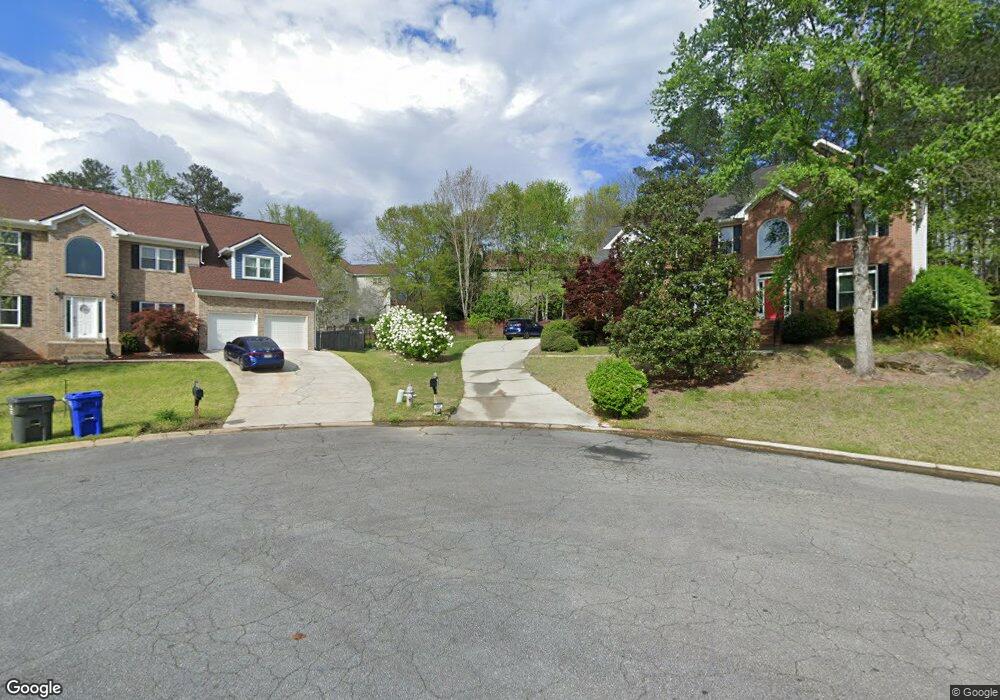
1770 Clayhill Ct SW Unit PTE Marietta, GA 30064
West Cobb NeighborhoodEstimated Value: $438,769 - $465,000
4
Beds
3
Baths
2,524
Sq Ft
$180/Sq Ft
Est. Value
About This Home
This home is located at 1770 Clayhill Ct SW Unit PTE, Marietta, GA 30064 and is currently estimated at $455,442, approximately $180 per square foot. 1770 Clayhill Ct SW Unit PTE is a home located in Cobb County with nearby schools including Dowell Elementary School, Lovinggood Middle School, and Hillgrove High School.
Ownership History
Date
Name
Owned For
Owner Type
Purchase Details
Closed on
Mar 3, 2017
Sold by
Mcdonald Owen H
Bought by
Wright Charles E and Wright Tisha
Current Estimated Value
Home Financials for this Owner
Home Financials are based on the most recent Mortgage that was taken out on this home.
Original Mortgage
$185,000
Outstanding Balance
$93,444
Interest Rate
4.19%
Mortgage Type
New Conventional
Estimated Equity
$361,998
Purchase Details
Closed on
Feb 25, 2000
Sold by
W Mark Ellis Co
Bought by
Mcdonald Owen H and Mcdonald Tracy L
Home Financials for this Owner
Home Financials are based on the most recent Mortgage that was taken out on this home.
Original Mortgage
$153,600
Interest Rate
8.3%
Mortgage Type
New Conventional
Create a Home Valuation Report for This Property
The Home Valuation Report is an in-depth analysis detailing your home's value as well as a comparison with similar homes in the area
Home Values in the Area
Average Home Value in this Area
Purchase History
| Date | Buyer | Sale Price | Title Company |
|---|---|---|---|
| Wright Charles E | $255,000 | -- | |
| Mcdonald Owen H | $192,000 | -- |
Source: Public Records
Mortgage History
| Date | Status | Borrower | Loan Amount |
|---|---|---|---|
| Open | Wright Charles E | $185,000 | |
| Previous Owner | Mcdonald Owen H | $153,600 |
Source: Public Records
Tax History Compared to Growth
Tax History
| Year | Tax Paid | Tax Assessment Tax Assessment Total Assessment is a certain percentage of the fair market value that is determined by local assessors to be the total taxable value of land and additions on the property. | Land | Improvement |
|---|---|---|---|---|
| 2025 | $4,218 | $171,808 | $34,000 | $137,808 |
| 2024 | $4,608 | $189,648 | $36,000 | $153,648 |
| 2023 | $2,912 | $136,452 | $21,600 | $114,852 |
| 2022 | $3,480 | $136,452 | $21,600 | $114,852 |
| 2021 | $2,935 | $111,568 | $21,600 | $89,968 |
| 2020 | $2,679 | $99,884 | $19,200 | $80,684 |
| 2019 | $2,679 | $99,884 | $19,200 | $80,684 |
| 2018 | $2,749 | $90,588 | $16,000 | $74,588 |
| 2017 | $2,205 | $90,588 | $16,000 | $74,588 |
| 2016 | $1,884 | $75,924 | $16,000 | $59,924 |
| 2015 | $1,990 | $78,564 | $16,000 | $62,564 |
| 2014 | $1,903 | $73,992 | $0 | $0 |
Source: Public Records
Map
Nearby Homes
- 1853 Edington Rd SW
- 1884 Dovonshire Rd SW
- 1843 Edington Rd SW
- 1841 Edington Rd SW
- 2409 Caneridge Point SW
- 2040 Hardwood Cir SW Unit 3
- 2117 Caneridge Dr SW
- 2166 Derbyshire Dr SW
- 2093 Breconridge Dr SW
- 1985 Freestone Way
- 2009 Freestone Way
- Monteluce Plan at Freestone Station
- Hillside Plan at Freestone Station
- Oakshire Plan at Freestone Station
- Hendricks Plan at Freestone Station
- Hedgerow Plan at Freestone Station
- Antioch Plan at Freestone Station
- 2146 Caneridge Dr SW
- 1952 Freestone Way
- 2284 Tree Arbor Way
- 1770 Clayhill Ct SW
- 1772 Clayhill Pointe SW
- 1770 Clayhill Pointe SW Unit SW
- 1770 Clayhill Pointe SW
- 1774 Clayhill Pointe SW
- 1765 Clayhill Pointe SW Unit 2
- 1768 Clayhill Ct SW Unit PTE
- 1772 Clayhill Ct SW
- 1772 Clayhill Ct SW Unit PTE
- 1787 Clayhill Pointe SW
- 1779 Clayhill Pointe SW
- 1869 Clay Dr SW
- 1774 Clayhill Ct SW Unit PTE
- 1760 Clayhill Pointe SW
- 1766 Clayhill Ct SW Unit PTE
- 1717 Clayhill Ct SW Unit 2
- 1867 Clay Dr SW
- 1716 Clayhill Ct SW Unit 2
- 1780 Clayhill Pointe SW
- 1763 Clayhill Pointe SW Unit 2