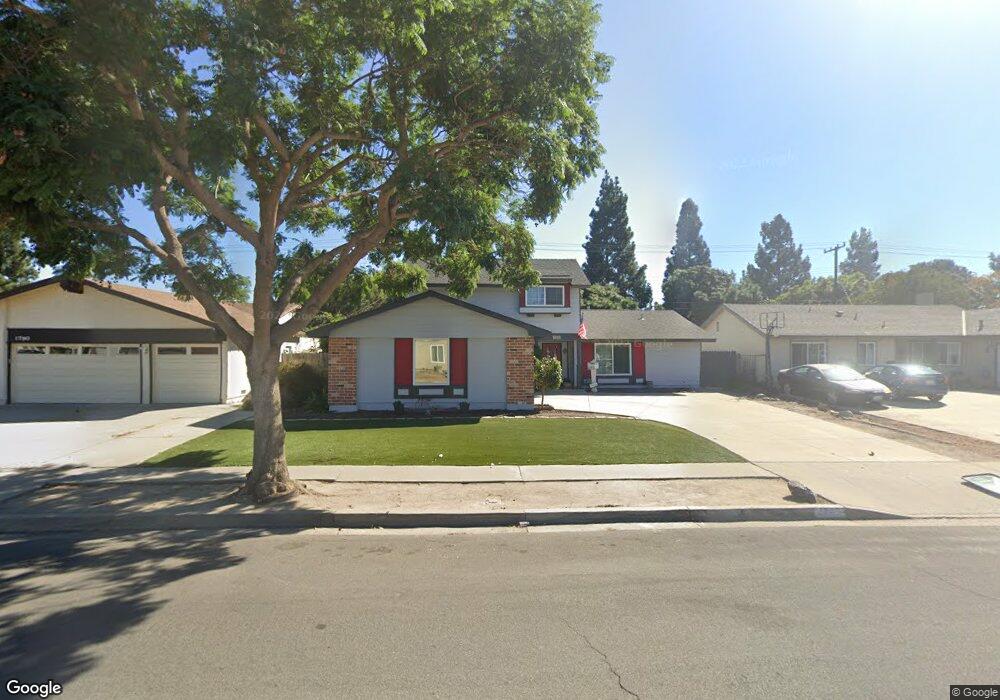
1772 Regent St Camarillo, CA 93010
Estimated Value: $810,000 - $924,000
4
Beds
3
Baths
1,837
Sq Ft
$479/Sq Ft
Est. Value
About This Home
This home is located at 1772 Regent St, Camarillo, CA 93010 and is currently estimated at $879,767, approximately $478 per square foot. 1772 Regent St is a home located in Ventura County with nearby schools including Dos Caminos Elementary School, Monte Vista Middle School, and Adolfo Camarillo High School.
Ownership History
Date
Name
Owned For
Owner Type
Purchase Details
Closed on
Aug 5, 2021
Sold by
Munowitch Matthew C and Kadin Jennifer Anne
Bought by
Munowitch Matthew C and Kadin Jennifer Anne
Current Estimated Value
Home Financials for this Owner
Home Financials are based on the most recent Mortgage that was taken out on this home.
Original Mortgage
$548,000
Outstanding Balance
$498,302
Interest Rate
2.9%
Mortgage Type
New Conventional
Estimated Equity
$381,465
Purchase Details
Closed on
Sep 28, 2017
Sold by
Munowitch Matthew C and Kadin Jennfer Anne
Bought by
Munowitch Matthew C and Kadin Jennifer Anne
Purchase Details
Closed on
Jul 8, 2011
Sold by
Pearce Ellita
Bought by
Munowitch Matthew C and Kadin Jennifer Anne
Home Financials for this Owner
Home Financials are based on the most recent Mortgage that was taken out on this home.
Original Mortgage
$407,403
Interest Rate
3.9%
Mortgage Type
FHA
Create a Home Valuation Report for This Property
The Home Valuation Report is an in-depth analysis detailing your home's value as well as a comparison with similar homes in the area
Home Values in the Area
Average Home Value in this Area
Purchase History
| Date | Buyer | Sale Price | Title Company |
|---|---|---|---|
| Munowitch Matthew C | -- | Orange Coast Title | |
| Munowitch Matthew C | -- | None Available | |
| Munowitch Matthew C | $418,000 | Chicago Title Company |
Source: Public Records
Mortgage History
| Date | Status | Borrower | Loan Amount |
|---|---|---|---|
| Open | Munowitch Matthew C | $548,000 | |
| Previous Owner | Munowitch Matthew C | $407,403 |
Source: Public Records
Tax History
| Year | Tax Paid | Tax Assessment Tax Assessment Total Assessment is a certain percentage of the fair market value that is determined by local assessors to be the total taxable value of land and additions on the property. | Land | Improvement |
|---|---|---|---|---|
| 2025 | $5,727 | $526,398 | $262,510 | $263,888 |
| 2024 | $5,727 | $516,077 | $257,363 | $258,714 |
| 2023 | $5,521 | $505,958 | $252,316 | $253,642 |
| 2022 | $5,503 | $496,038 | $247,369 | $248,669 |
| 2021 | $5,304 | $486,312 | $242,518 | $243,794 |
| 2020 | $5,285 | $481,328 | $240,032 | $241,296 |
| 2019 | $5,259 | $471,891 | $235,326 | $236,565 |
| 2018 | $5,162 | $462,639 | $230,712 | $231,927 |
| 2017 | $8,901 | $453,569 | $226,189 | $227,380 |
| 2016 | $8,784 | $444,676 | $221,754 | $222,922 |
| 2015 | $4,689 | $437,998 | $218,424 | $219,574 |
| 2014 | $4,594 | $429,421 | $214,147 | $215,274 |
Source: Public Records
Map
Nearby Homes
- 1682 Darnell Ct
- 1623 Regent St
- 560 Chapala Dr
- 1654 Edgewater Ln
- 425 Baja Ct
- 1767 Dunnigan St
- 2854 Via Monte Mar
- 1574 Habra Ct
- 2174 Wilcox St
- 647 Arneill Rd
- 1387 Lantana St
- 1910 Colonia Place
- 1075 Seybolt Ave
- 1487 Nordman Dr
- 1150 Ventura Blvd Unit 77
- 1150 Ventura Blvd Unit 109
- 1150 Ventura Blvd Unit SPC 125
- 1150 Ventura Blvd Unit 110
- 1150 Ventura Blvd Unit 62
- 239 Cartagena St
- 1754 Regent St
- 1790 Regent St
- 1726 Regent St
- 1771 Regent St
- 1753 Regent St
- 1789 Regent St
- 1708 Regent St
- 1804 Regent St
- 1725 Regent St
- 1707 Regent St
- 755 Brently Ave
- 1822 Regent St
- 754 Brently Ave
- 1694 Darnell Ct
- 1783 Onda Dr
- 1693 Regent St
- 1734 Shoreline St
- 770 Brently Ave
- 1728 Shoreline St
- 1670 Darnell Ct
Your Personal Tour Guide
Ask me questions while you tour the home.