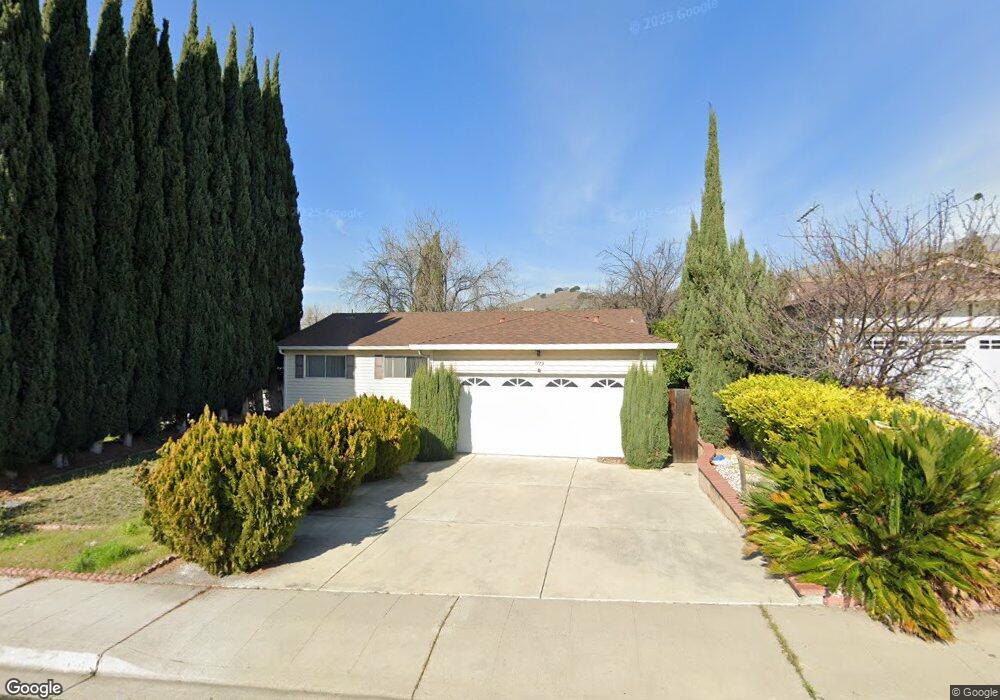
1773 Fair Hill Dr Milpitas, CA 95035
Estimated Value: $1,381,000 - $1,606,000
3
Beds
2
Baths
1,242
Sq Ft
$1,198/Sq Ft
Est. Value
About This Home
This home is located at 1773 Fair Hill Dr, Milpitas, CA 95035 and is currently estimated at $1,487,598, approximately $1,197 per square foot. 1773 Fair Hill Dr is a home located in Santa Clara County with nearby schools including William Burnett Elementary School, Rancho Milpitas Middle School, and Milpitas High School.
Ownership History
Date
Name
Owned For
Owner Type
Purchase Details
Closed on
Jul 20, 2007
Sold by
Zhang Sai Feng
Bought by
Shi Songtao and Xie Xuemei
Current Estimated Value
Home Financials for this Owner
Home Financials are based on the most recent Mortgage that was taken out on this home.
Original Mortgage
$500,000
Outstanding Balance
$316,251
Interest Rate
6.73%
Mortgage Type
Purchase Money Mortgage
Estimated Equity
$1,171,347
Purchase Details
Closed on
Jan 24, 2006
Sold by
Chen Guan Qi
Bought by
Zhang Sai Feng
Purchase Details
Closed on
Aug 14, 2000
Sold by
Ogden Calvin F and Ogden Anna L
Bought by
Zhang Sai Feng
Home Financials for this Owner
Home Financials are based on the most recent Mortgage that was taken out on this home.
Original Mortgage
$380,000
Interest Rate
8.15%
Create a Home Valuation Report for This Property
The Home Valuation Report is an in-depth analysis detailing your home's value as well as a comparison with similar homes in the area
Home Values in the Area
Average Home Value in this Area
Purchase History
| Date | Buyer | Sale Price | Title Company |
|---|---|---|---|
| Shi Songtao | $647,500 | Old Republic Title Company | |
| Zhang Sai Feng | -- | None Available | |
| Zhang Sai Feng | $410,000 | American Title Co | |
| Zhange Sai Feng | -- | American Title Co |
Source: Public Records
Mortgage History
| Date | Status | Borrower | Loan Amount |
|---|---|---|---|
| Open | Shi Songtao | $500,000 | |
| Previous Owner | Zhang Sai Feng | $380,000 |
Source: Public Records
Tax History
| Year | Tax Paid | Tax Assessment Tax Assessment Total Assessment is a certain percentage of the fair market value that is determined by local assessors to be the total taxable value of land and additions on the property. | Land | Improvement |
|---|---|---|---|---|
| 2025 | $9,700 | $849,834 | $558,238 | $291,596 |
| 2024 | $9,700 | $833,172 | $547,293 | $285,879 |
| 2023 | $9,668 | $816,836 | $536,562 | $280,274 |
| 2022 | $9,627 | $800,821 | $526,042 | $274,779 |
| 2021 | $9,487 | $785,120 | $515,728 | $269,392 |
| 2020 | $9,321 | $777,070 | $510,440 | $266,630 |
| 2019 | $9,213 | $761,834 | $500,432 | $261,402 |
| 2018 | $8,748 | $746,897 | $490,620 | $256,277 |
| 2017 | $8,634 | $732,252 | $481,000 | $251,252 |
| 2016 | $8,284 | $717,895 | $471,569 | $246,326 |
| 2015 | $7,424 | $639,000 | $419,700 | $219,300 |
| 2014 | $6,436 | $557,000 | $365,900 | $191,100 |
Source: Public Records
Map
Nearby Homes
- 1995 Old Calaveras Rd
- 395 Fanyon St
- 25 Terfidia Ln
- 35 Terfidia Ln
- 2118 Old Calaveras Rd
- 1647 Jupiter Dr
- 136 Lawton Dr
- 1787 Canton Dr
- 320 Monmouth Dr
- 1103 Creed St
- 397 S Park Victoria Dr
- 808 Cameron Cir
- 484 Dempsey Rd Unit 186
- 1321 Terra Vista Ct
- 375 Dempsey Rd
- 529 Bryce Ct
- 685 Parvin Dr
- 1000 Jacklin Rd
- 1394 Glacier Dr
- 1260 Glacier Dr
- 1785 Fair Hill Dr
- 1761 Fair Hill Dr
- 1797 Fair Hill Dr
- 1749 Fair Hill Dr
- 1776 Kennedy Dr
- 1788 Kennedy Dr
- 1764 Kennedy Dr
- 1800 Kennedy Dr
- 381 Spring Valley Ln
- 1778 Fair Hill Dr
- 1737 Fair Hill Dr
- 1752 Kennedy Dr
- 1766 Fair Hill Dr
- 1812 Kennedy Dr
- 1809 Fair Hill Dr
- 1754 Fair Hill Dr
- 1740 Kennedy Dr
- 373 Spring Valley Ln
- 1725 Fair Hill Dr
- 392 Spring Valley Ln
Your Personal Tour Guide
Ask me questions while you tour the home.