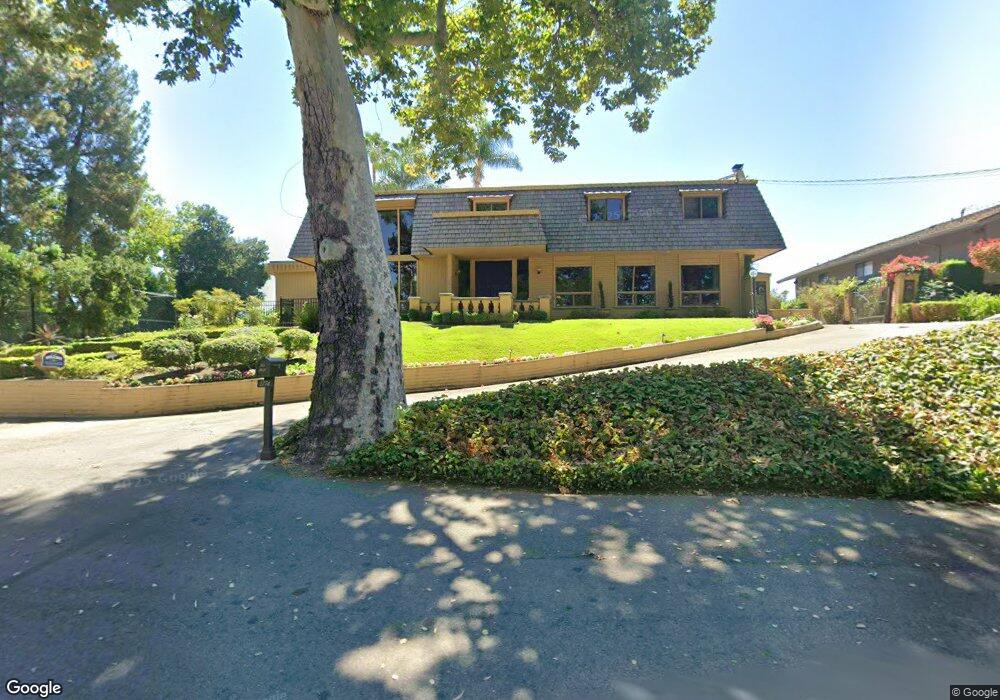
1774 Dry Creek Rd San Jose, CA 95124
Willow Glen NeighborhoodEstimated Value: $3,922,000 - $5,846,000
6
Beds
4
Baths
4,257
Sq Ft
$1,107/Sq Ft
Est. Value
About This Home
This home is located at 1774 Dry Creek Rd, San Jose, CA 95124 and is currently estimated at $4,713,975, approximately $1,107 per square foot. 1774 Dry Creek Rd is a home located in Santa Clara County with nearby schools including Booksin Elementary, Willow Glen Middle, and Willow Glen High School.
Ownership History
Date
Name
Owned For
Owner Type
Purchase Details
Closed on
Apr 27, 1999
Sold by
Schiro Shirlee D
Bought by
Schiro Shirlee Dinapoli
Current Estimated Value
Purchase Details
Closed on
Jul 29, 1996
Sold by
Haythornewhite Raymond and Morrow Joseph Eli
Bought by
Battaglia W L
Home Financials for this Owner
Home Financials are based on the most recent Mortgage that was taken out on this home.
Original Mortgage
$340,200
Interest Rate
8.12%
Purchase Details
Closed on
Jun 7, 1996
Sold by
Schiro Henry A
Bought by
Schiro Shirlee Dinapoli
Home Financials for this Owner
Home Financials are based on the most recent Mortgage that was taken out on this home.
Original Mortgage
$340,200
Interest Rate
8.12%
Purchase Details
Closed on
Sep 15, 1995
Sold by
Schiro Shirlee Dinapoli
Bought by
Schiro Henry A
Create a Home Valuation Report for This Property
The Home Valuation Report is an in-depth analysis detailing your home's value as well as a comparison with similar homes in the area
Home Values in the Area
Average Home Value in this Area
Purchase History
| Date | Buyer | Sale Price | Title Company |
|---|---|---|---|
| Schiro Shirlee Dinapoli | -- | -- | |
| Battaglia W L | $268,000 | Old Republic Title Company | |
| Schiro Shirlee Dinapoli | -- | All Cal Title Company | |
| Schiro Henry A | -- | Old Republic Title Company |
Source: Public Records
Mortgage History
| Date | Status | Borrower | Loan Amount |
|---|---|---|---|
| Previous Owner | Schiro Shirlee Dinapoli | $340,200 |
Source: Public Records
Tax History Compared to Growth
Tax History
| Year | Tax Paid | Tax Assessment Tax Assessment Total Assessment is a certain percentage of the fair market value that is determined by local assessors to be the total taxable value of land and additions on the property. | Land | Improvement |
|---|---|---|---|---|
| 2025 | $9,258 | $5,150,000 | $4,250,000 | $900,000 |
| 2024 | $9,258 | $619,338 | $115,036 | $504,302 |
| 2023 | $9,051 | $607,195 | $112,781 | $494,414 |
| 2022 | $8,954 | $595,290 | $110,570 | $484,720 |
| 2021 | $8,715 | $583,618 | $108,402 | $475,216 |
| 2020 | $8,432 | $577,635 | $107,291 | $470,344 |
| 2019 | $8,213 | $566,310 | $105,188 | $461,122 |
| 2018 | $8,941 | $555,207 | $103,126 | $452,081 |
| 2017 | $8,835 | $544,321 | $101,104 | $443,217 |
| 2016 | $8,625 | $533,649 | $99,122 | $434,527 |
| 2015 | $8,569 | $525,634 | $97,634 | $428,000 |
| 2014 | $6,957 | $515,339 | $95,722 | $419,617 |
Source: Public Records
Map
Nearby Homes
- 1829 Cabana Dr
- 2322 Meridian Ave
- 2392 Walden Square
- 1898 Meridian Ave Unit 29
- 1860 Leigh Ave
- 1791 Frobisher Way
- 2498 Raleigh Dr
- 1831 Frobisher Way
- 2425 Briarwood Dr
- 2538 Custer Dr
- 1735 Whispering Willow Place
- 1705 Harte Dr
- 1741 Harte Dr
- 1665 Fairorchard Ave
- 1721 Braddock Ct
- 1751 Braddock Ct
- 1650 Fairorchard Ave
- 2538 Saint Lawrence Dr
- 1549 Keesling Ave
- 1430 Callecita St
- 1795 Kirkmont Dr
- 1787 Kirkmont Dr
- 1778 Dry Creek Rd
- 1797 Kirkmont Dr
- 2052 Dry Creek Way
- 1801 Kirkmont Dr
- 1781 Kirkmont Dr
- 2247 Dry Creek Rd
- 2241 Dry Creek Rd
- 1782 Dry Creek Rd
- 1805 Kirkmont Dr
- 1808 Monte Carlo Way
- 1766 Dry Creek Rd
- 1792 Kirkmont Dr
- 1777 Kirkmont Dr
- 1788 Kirkmont Dr
- 2156 Constitution Dr
- 2255 Dry Creek Rd
- 1784 Kirkmont Dr
- 2231 Dry Creek Rd