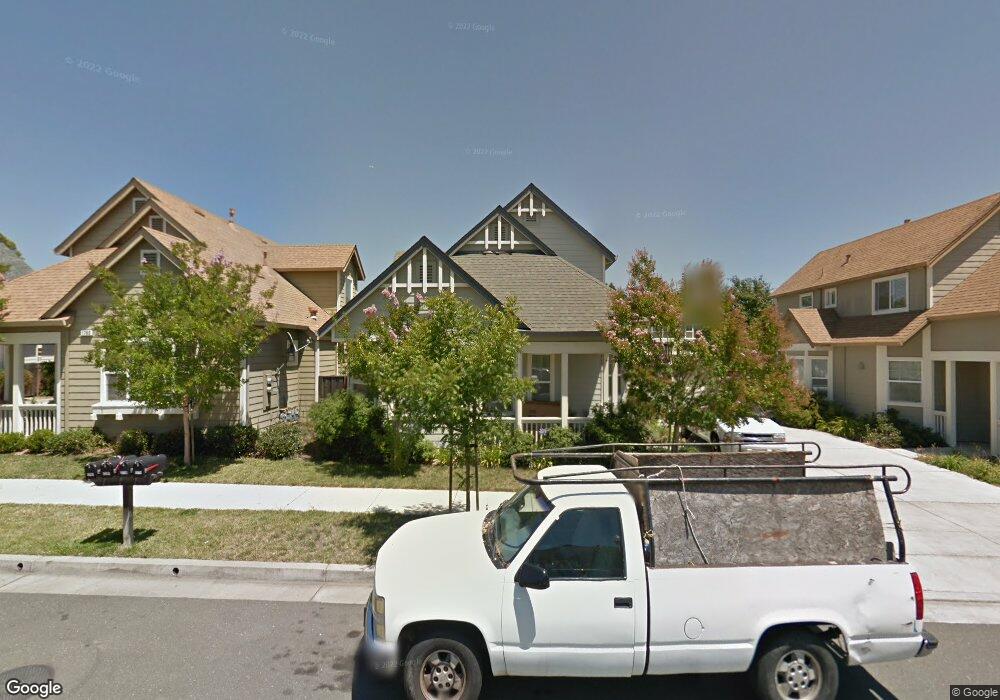
1774 Waltzer Rd Santa Rosa, CA 95403
Northwest Santa Rosa NeighborhoodEstimated Value: $585,000 - $960,000
4
Beds
3
Baths
2,386
Sq Ft
$324/Sq Ft
Est. Value
About This Home
This home is located at 1774 Waltzer Rd, Santa Rosa, CA 95403 and is currently estimated at $774,000, approximately $324 per square foot. 1774 Waltzer Rd is a home located in Sonoma County with nearby schools including James Monroe Elementary School, Hilliard Comstock Middle School, and Piner High School.
Ownership History
Date
Name
Owned For
Owner Type
Purchase Details
Closed on
May 17, 2025
Sold by
Hsieh Ji Nan and Gong Tina Oi
Bought by
Hsiehgong Trust and Hsieh
Current Estimated Value
Purchase Details
Closed on
Dec 1, 2011
Sold by
Carinalli Kevin E
Bought by
Hsieh Ji Nan and Gong Tina O
Home Financials for this Owner
Home Financials are based on the most recent Mortgage that was taken out on this home.
Original Mortgage
$230,000
Interest Rate
4.06%
Mortgage Type
Commercial
Purchase Details
Closed on
Jan 8, 2007
Sold by
Carinalli Heather
Bought by
Carinalli Kevin E
Home Financials for this Owner
Home Financials are based on the most recent Mortgage that was taken out on this home.
Original Mortgage
$510,300
Interest Rate
7.43%
Mortgage Type
Negative Amortization
Create a Home Valuation Report for This Property
The Home Valuation Report is an in-depth analysis detailing your home's value as well as a comparison with similar homes in the area
Home Values in the Area
Average Home Value in this Area
Purchase History
| Date | Buyer | Sale Price | Title Company |
|---|---|---|---|
| Hsiehgong Trust | -- | None Listed On Document | |
| Hsieh Ji Nan | $370,000 | North American Title Company | |
| Carinalli Kevin E | -- | Financial Title Company | |
| Carinalli Kevin E | $724,000 | Financial Title Company |
Source: Public Records
Mortgage History
| Date | Status | Borrower | Loan Amount |
|---|---|---|---|
| Previous Owner | Hsieh Ji Nan | $230,000 | |
| Previous Owner | Carinalli Kevin E | $510,300 |
Source: Public Records
Tax History Compared to Growth
Tax History
| Year | Tax Paid | Tax Assessment Tax Assessment Total Assessment is a certain percentage of the fair market value that is determined by local assessors to be the total taxable value of land and additions on the property. | Land | Improvement |
|---|---|---|---|---|
| 2025 | $5,269 | $464,726 | $113,037 | $351,689 |
| 2024 | $5,269 | $455,615 | $110,821 | $344,794 |
| 2023 | $5,269 | $446,683 | $108,649 | $338,034 |
| 2022 | $4,868 | $437,925 | $106,519 | $331,406 |
| 2021 | $4,809 | $429,339 | $104,431 | $324,908 |
| 2020 | $4,014 | $424,938 | $103,361 | $321,577 |
| 2019 | $4,774 | $416,607 | $101,335 | $315,272 |
| 2018 | $4,748 | $408,440 | $99,349 | $309,091 |
| 2017 | $4,663 | $400,432 | $97,401 | $303,031 |
| 2016 | $4,629 | $392,582 | $95,492 | $297,090 |
| 2015 | $4,490 | $386,686 | $94,058 | $292,628 |
| 2014 | $4,217 | $379,112 | $92,216 | $286,896 |
Source: Public Records
Map
Nearby Homes
- 2976 Bay Village Ave
- 2110 Northfield Dr
- 1906 Genoa Place
- 1945 Piner Rd Unit 16
- 1945 Piner Rd Unit 148
- 1945 Piner Rd Unit 185
- 1945 Piner Rd Unit 47
- 1945 Piner Rd Unit 105
- 1945 Piner Rd Unit 189
- 1905 Belair Way
- 2137 Avilar Place
- 2324 Hickock Ct
- 2320 Masterson Ct
- 1921 Bronco St
- 2299 San Miguel Ave
- 2234 Gold Leaf Ln
- 2289 Claiborne Cir
- 2311 San Miguel Ave
- 3511 Barnes Rd
- 2522 Sam Dr
- 1768 Waltzer Rd
- 1780 Waltzer Rd
- 1762 Waltzer Rd
- 1786 Waltzer Rd
- 2088 Piner Rd
- 1756 Waltzer Rd
- 1888 Bodie St
- 1773 Waltzer Rd
- 1794 Waltzer Rd
- 1882 Bodie St
- 1779 Waltzer Rd
- 1767 Waltzer Rd
- 1750 Waltzer Rd
- 1785 Waltzer Rd
- 1761 Waltzer Rd
- 1742 Waltzer Rd
- 1738 Waltzer Rd
- 1791 Waltzer Rd
- 1755 Waltzer Rd
- 1746 Waltzer Rd