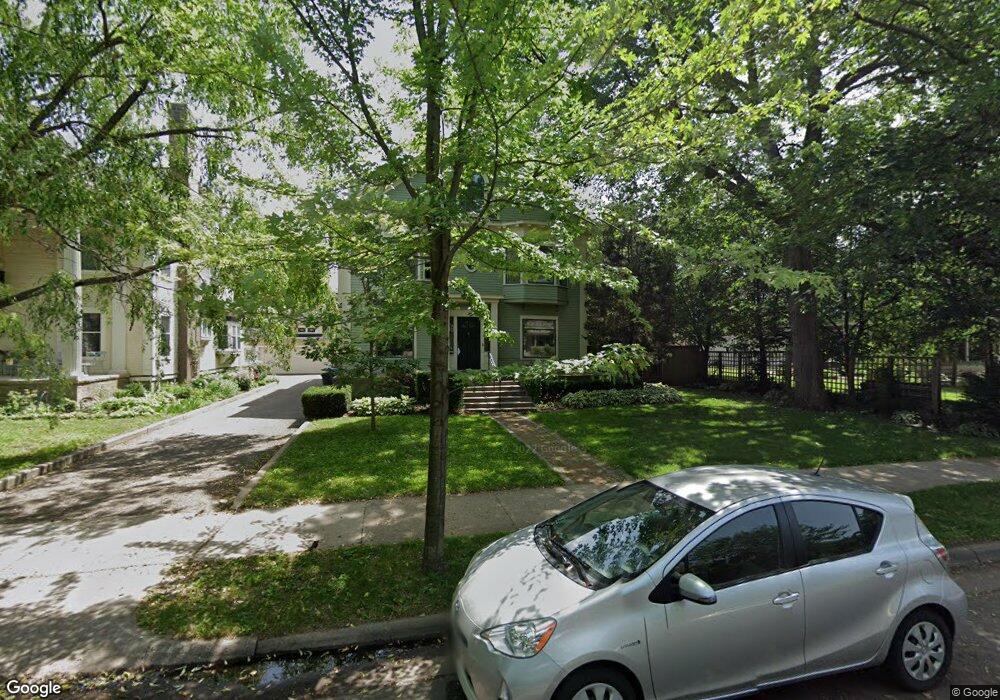
1775 Fremont Ave S Unit 2 Minneapolis, MN 55403
Lowry Hill NeighborhoodEstimated Value: $335,000 - $434,000
2
Beds
1
Bath
1,526
Sq Ft
$255/Sq Ft
Est. Value
About This Home
This home is located at 1775 Fremont Ave S Unit 2, Minneapolis, MN 55403 and is currently estimated at $389,690, approximately $255 per square foot. 1775 Fremont Ave S Unit 2 is a home located in Hennepin County with nearby schools including Kenwood Elementary School, Anwatin Middle School, and North High School.
Ownership History
Date
Name
Owned For
Owner Type
Purchase Details
Closed on
Jul 2, 2020
Sold by
Thoes Brian D
Bought by
Garcia Daniel A
Current Estimated Value
Home Financials for this Owner
Home Financials are based on the most recent Mortgage that was taken out on this home.
Original Mortgage
$286,221
Outstanding Balance
$253,802
Interest Rate
3.1%
Mortgage Type
New Conventional
Estimated Equity
$135,888
Purchase Details
Closed on
Jan 13, 2018
Sold by
Shuster Sandra G
Bought by
Thoes Brian D
Home Financials for this Owner
Home Financials are based on the most recent Mortgage that was taken out on this home.
Original Mortgage
$245,880
Interest Rate
3.93%
Mortgage Type
New Conventional
Purchase Details
Closed on
Apr 14, 2000
Sold by
Shuster Sandra G
Bought by
Torgerson David B
Purchase Details
Closed on
Mar 31, 1999
Sold by
Todd Caroline J
Bought by
Torgerson David B
Create a Home Valuation Report for This Property
The Home Valuation Report is an in-depth analysis detailing your home's value as well as a comparison with similar homes in the area
Home Values in the Area
Average Home Value in this Area
Purchase History
| Date | Buyer | Sale Price | Title Company |
|---|---|---|---|
| Garcia Daniel A | $315,000 | Edina Realty Title Inc | |
| Thoes Brian D | $273,200 | Burnet Title | |
| Torgerson David B | $214,900 | -- | |
| Torgerson David B | $180,000 | -- |
Source: Public Records
Mortgage History
| Date | Status | Borrower | Loan Amount |
|---|---|---|---|
| Open | Garcia Daniel A | $286,221 | |
| Previous Owner | Thoes Brian D | $245,880 |
Source: Public Records
Tax History Compared to Growth
Tax History
| Year | Tax Paid | Tax Assessment Tax Assessment Total Assessment is a certain percentage of the fair market value that is determined by local assessors to be the total taxable value of land and additions on the property. | Land | Improvement |
|---|---|---|---|---|
| 2024 | $4,795 | $338,000 | $110,000 | $228,000 |
| 2023 | $4,323 | $338,000 | $110,000 | $228,000 |
| 2022 | $4,223 | $322,000 | $110,000 | $212,000 |
| 2021 | $3,694 | $313,000 | $121,000 | $192,000 |
| 2020 | $3,988 | $286,000 | $136,000 | $150,000 |
| 2019 | $4,107 | $275,000 | $136,000 | $139,000 |
| 2018 | $4,899 | $275,000 | $136,000 | $139,000 |
| 2017 | $4,564 | $296,500 | $123,600 | $172,900 |
| 2016 | $4,709 | $296,500 | $123,600 | $172,900 |
| 2015 | $4,706 | $282,500 | $123,600 | $158,900 |
| 2014 | -- | $282,500 | $101,200 | $181,300 |
Source: Public Records
Map
Nearby Homes
- 1767 Fremont Ave S
- 1212 Douglas Ave
- 1785 Dupont Ave S
- 1912 Dupont Ave S Unit 407
- 1820 Colfax Ave S
- 1932 Dupont Ave S
- 1721 Humboldt Ave S Unit 1
- 1940 Dupont Ave S
- 910 Lincoln Ave Unit B4
- 821 Douglas Ave Unit 304
- 821 Douglas Ave Unit 204
- 2112 Emerson Ave S Unit 3
- 1527 Waverly Place
- 1776 Knox Ave S
- 1770 Knox Ave S
- 510 Groveland Ave Unit 522
- 2109 James Ave S
- 520 Ridgewood Ave Unit 4
- 520 Ridgewood Ave Unit 107
- 1013 Kenwood Pkwy
- 1775 Fremont Ave S Unit 1
- 1775 1775 Fremont-Avenue-s
- 1218 Summit Ave
- 1774 Emerson Ave S
- 1770 Emerson Ave S
- 1778 Emerson Ave S
- 1766 Emerson Ave S
- 1774 Fremont Ave S
- 1200 Summit Ave
- 1770 Fremont Ave S
- 1776 Fremont Ave S
- 1768 Fremont Ave S
- 1216 Douglas Ave
- 1782 Fremont Ave S
- 1222 Douglas Ave
- 1220 Douglas Ave
- 1788 Fremont Ave S
- 1788 Fremont Ave S Unit Penthouse
- 1724 Emerson Ave S
- 1801 Fremont Ave S Unit 201