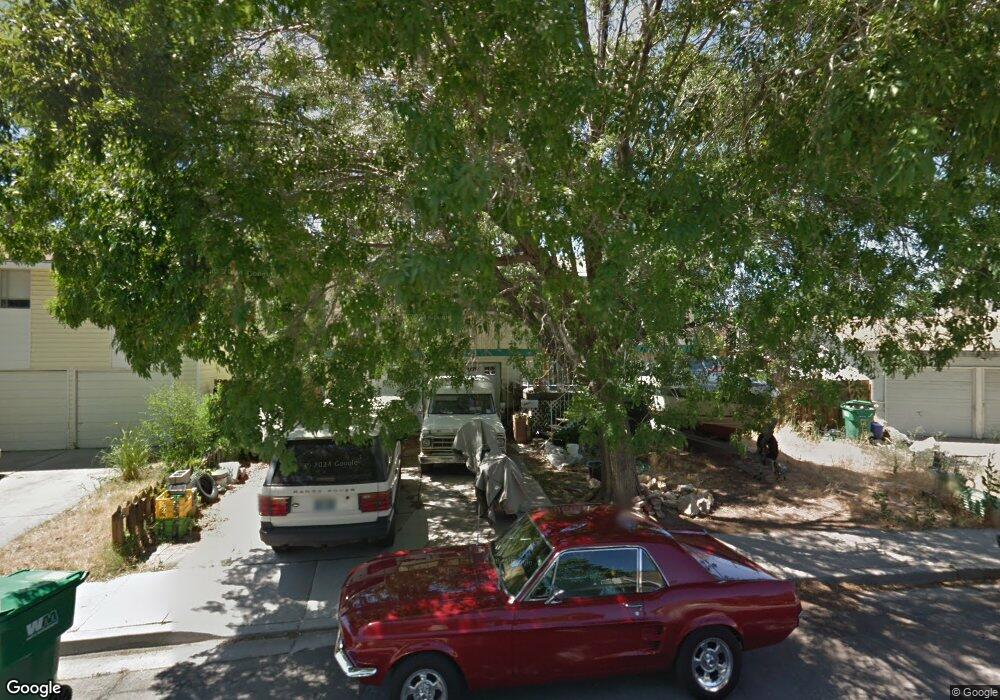
1777 Verbena Way Sparks, NV 89431
McCarran Boulevard-Probasco NeighborhoodEstimated Value: $469,000 - $538,000
3
Beds
2
Baths
1,772
Sq Ft
$283/Sq Ft
Est. Value
About This Home
This home is located at 1777 Verbena Way, Sparks, NV 89431 and is currently estimated at $501,305, approximately $282 per square foot. 1777 Verbena Way is a home located in Washoe County with nearby schools including Greenbrae Elementary School, George L Dilworth Middle School, and Sparks High School.
Ownership History
Date
Name
Owned For
Owner Type
Purchase Details
Closed on
May 11, 2005
Sold by
Rushing Daniel and Rushing Melissa
Bought by
Walker Richard G
Current Estimated Value
Home Financials for this Owner
Home Financials are based on the most recent Mortgage that was taken out on this home.
Original Mortgage
$266,000
Outstanding Balance
$140,117
Interest Rate
6%
Mortgage Type
New Conventional
Estimated Equity
$361,188
Purchase Details
Closed on
Dec 18, 2003
Sold by
White Lois Jean
Bought by
Rushing Daniel and Rushing Melissa
Home Financials for this Owner
Home Financials are based on the most recent Mortgage that was taken out on this home.
Original Mortgage
$175,750
Interest Rate
4.75%
Mortgage Type
Unknown
Purchase Details
Closed on
Nov 13, 1998
Sold by
White Lois J
Bought by
White Lois Jean and Lois Jean White Trust
Create a Home Valuation Report for This Property
The Home Valuation Report is an in-depth analysis detailing your home's value as well as a comparison with similar homes in the area
Home Values in the Area
Average Home Value in this Area
Purchase History
| Date | Buyer | Sale Price | Title Company |
|---|---|---|---|
| Walker Richard G | $280,000 | Western Title Incorporated | |
| Rushing Daniel | $185,000 | First Centennial Title Co | |
| White Lois Jean | -- | -- |
Source: Public Records
Mortgage History
| Date | Status | Borrower | Loan Amount |
|---|---|---|---|
| Open | Walker Richard G | $266,000 | |
| Previous Owner | Rushing Daniel | $175,750 |
Source: Public Records
Tax History Compared to Growth
Tax History
| Year | Tax Paid | Tax Assessment Tax Assessment Total Assessment is a certain percentage of the fair market value that is determined by local assessors to be the total taxable value of land and additions on the property. | Land | Improvement |
|---|---|---|---|---|
| 2025 | $1,831 | $70,860 | $33,565 | $37,295 |
| 2024 | $1,831 | $68,430 | $30,065 | $38,365 |
| 2023 | $1,777 | $68,411 | $31,325 | $37,086 |
| 2022 | $1,727 | $57,716 | $26,180 | $31,536 |
| 2021 | $1,676 | $50,019 | $17,955 | $32,064 |
| 2020 | $1,626 | $49,708 | $16,940 | $32,768 |
| 2019 | $1,578 | $48,005 | $15,890 | $32,115 |
| 2018 | $1,532 | $43,758 | $11,725 | $32,033 |
| 2017 | $1,488 | $42,982 | $10,395 | $32,587 |
| 2016 | $1,450 | $43,102 | $9,345 | $33,757 |
| 2015 | $1,447 | $42,416 | $7,700 | $34,716 |
| 2014 | $1,407 | $39,797 | $6,440 | $33,357 |
| 2013 | -- | $37,590 | $4,270 | $33,320 |
Source: Public Records
Map
Nearby Homes
- 370 O'Brien Way
- 8 E O St
- 385 Gleeson Way
- 1703 1st St
- 10 Sheridan Way
- 848 Parkside Dr Unit 1
- 1973 Rio Tinto Dr
- 745 Glen Vista Dr
- 949 Crestwood Dr Unit 3
- 801 Woodglen Dr Unit 2
- 1940 4th St Unit 20
- 1940 4th St Unit 51
- 300 I St
- 3071 Meadowlands Dr
- 1897 Bonita Vista Dr
- 119 Devere Way
- 1945 4th St Unit 32
- 1945 4th St Unit 33
- 1945 4th St Unit 10
- 913 Glen Molly Dr
- 1757 Verbena Way
- 1797 Verbena Way
- 365 E Quail St
- 1727 Verbena Way
- 315 E Quail St
- 1707 Verbena Way
- 1798 Verbena Way
- 1768 Verbena Way
- 303 E Quail St
- 1718 Verbena Way
- 366 E Quail St
- 1657 Verbena Way
- 316 E Quail St
- 396 E Quail St
- 295 E Quail St
- 493 E Quail St
- 462 Oleander Way
- 416 E Quail St
- 306 E Quail St
- 494 Oleander Way