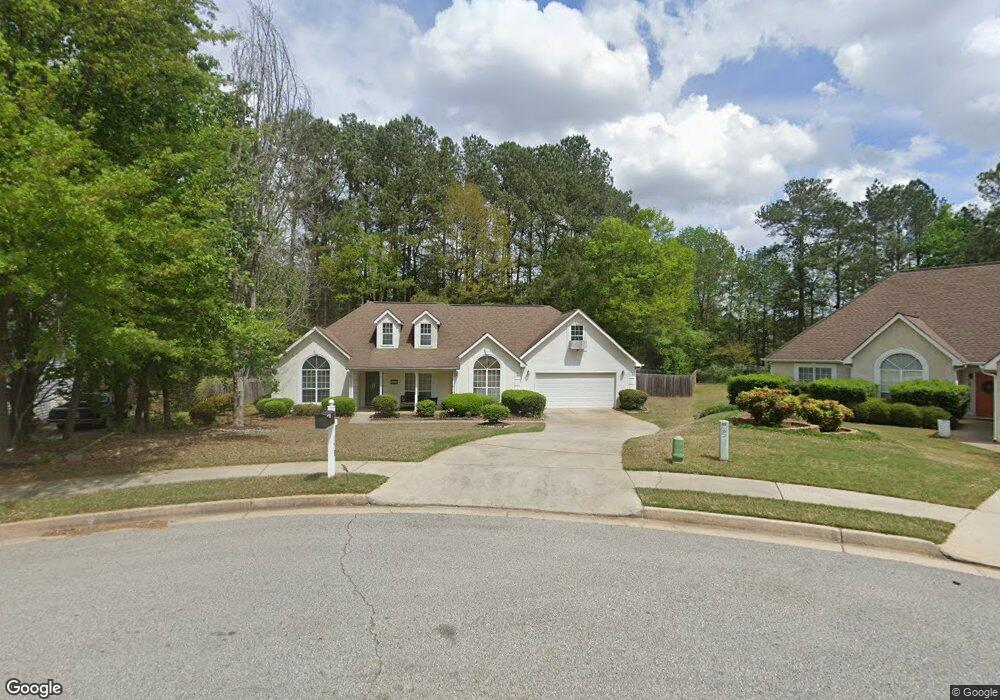
178 Parkside Dr Unit II Stockbridge, GA 30281
Estimated Value: $298,000 - $336,000
3
Beds
2
Baths
2,096
Sq Ft
$150/Sq Ft
Est. Value
About This Home
This home is located at 178 Parkside Dr Unit II, Stockbridge, GA 30281 and is currently estimated at $315,093, approximately $150 per square foot. 178 Parkside Dr Unit II is a home located in Henry County with nearby schools including Flippen Elementary School, Eagle's Landing Middle School, and Eagle's Landing High School.
Ownership History
Date
Name
Owned For
Owner Type
Purchase Details
Closed on
Nov 5, 2002
Sold by
Hudson Maxine
Bought by
Hudson Victor and Hudson Maxine
Current Estimated Value
Purchase Details
Closed on
Jul 19, 2001
Sold by
Hudson Maxine
Bought by
Hudson Maxine and Hudson Victor
Home Financials for this Owner
Home Financials are based on the most recent Mortgage that was taken out on this home.
Original Mortgage
$159,004
Interest Rate
6.89%
Mortgage Type
FHA
Purchase Details
Closed on
Aug 30, 1999
Sold by
Pope Robert G and Pope Carol A
Bought by
Winks Mary E
Home Financials for this Owner
Home Financials are based on the most recent Mortgage that was taken out on this home.
Original Mortgage
$153,000
Interest Rate
8.75%
Mortgage Type
New Conventional
Purchase Details
Closed on
Sep 11, 1998
Sold by
Browning Nancy R
Bought by
Pope Robert G and Pope Carol A
Purchase Details
Closed on
Oct 21, 1996
Sold by
Johnson Homes
Bought by
Browning Nancy
Create a Home Valuation Report for This Property
The Home Valuation Report is an in-depth analysis detailing your home's value as well as a comparison with similar homes in the area
Home Values in the Area
Average Home Value in this Area
Purchase History
| Date | Buyer | Sale Price | Title Company |
|---|---|---|---|
| Hudson Victor | -- | -- | |
| Hudson Maxine | -- | -- | |
| Hudson Maxine | $164,900 | -- | |
| Winks Mary E | $153,000 | -- | |
| Pope Robert G | $140,000 | -- | |
| Browning Nancy | $129,700 | -- |
Source: Public Records
Mortgage History
| Date | Status | Borrower | Loan Amount |
|---|---|---|---|
| Previous Owner | Hudson Maxine | $159,004 | |
| Previous Owner | Winks Mary E | $153,000 | |
| Closed | Browning Nancy | $0 |
Source: Public Records
Tax History Compared to Growth
Tax History
| Year | Tax Paid | Tax Assessment Tax Assessment Total Assessment is a certain percentage of the fair market value that is determined by local assessors to be the total taxable value of land and additions on the property. | Land | Improvement |
|---|---|---|---|---|
| 2025 | $3,944 | $131,880 | $16,000 | $115,880 |
| 2024 | $3,944 | $134,120 | $16,000 | $118,120 |
| 2023 | $2,970 | $125,440 | $18,000 | $107,440 |
| 2022 | $3,160 | $96,000 | $14,000 | $82,000 |
| 2021 | $2,813 | $81,360 | $14,000 | $67,360 |
| 2020 | $2,638 | $73,920 | $12,000 | $61,920 |
| 2019 | $2,437 | $68,880 | $10,000 | $58,880 |
| 2018 | $2,297 | $62,960 | $10,000 | $52,960 |
| 2016 | $1,993 | $54,360 | $8,000 | $46,360 |
| 2015 | $1,944 | $51,920 | $8,000 | $43,920 |
| 2014 | $1,812 | $48,160 | $8,000 | $40,160 |
Source: Public Records
Map
Nearby Homes
- 228 Kensington Trace
- 169 Parkside Dr
- 214 Kensington Trace
- 209 Kensington Trace
- 104 Riverside Close
- 200 Kensington Trace
- 601 Sawgrass Walk
- 805 Cog Hill
- 418 Abbey Springs Way
- 241 Legends Trace
- 941 Arbor Way
- 129 Breton Highlands
- 205 Legends Trace
- 153 Rockport Dr
- 816 Cog Hill
- 1016 Collingtree Ct
- 834 Chalet Hills
- 900 Ellesmere Point
- 401 Crosshaven Way
- 180 Parkside Dr Unit II
- 176 Parkside Dr Unit 2
- 239 Kensington Trace
- 239 Kensington Trace Unit 3
- 241 Kensington Trace
- 237 Kensington Trace
- 243 Kensington Trace Unit 3
- 174 Parkside Dr
- 182 Parkside Dr
- 235 Kensington Trace Unit 3
- 185 Parkside Dr Unit II
- 172 Parkside Dr
- 245 Kensington Trace Unit 38E
- 245 Kensington Trace
- 183 Parkside Dr
- 240 Kensington Trace
- 181 Parkside Dr Unit 2
- 242 Kensington Trace Unit 3
- 247 Kensington Trc
- 352 Royal Crescent Way Unit 2