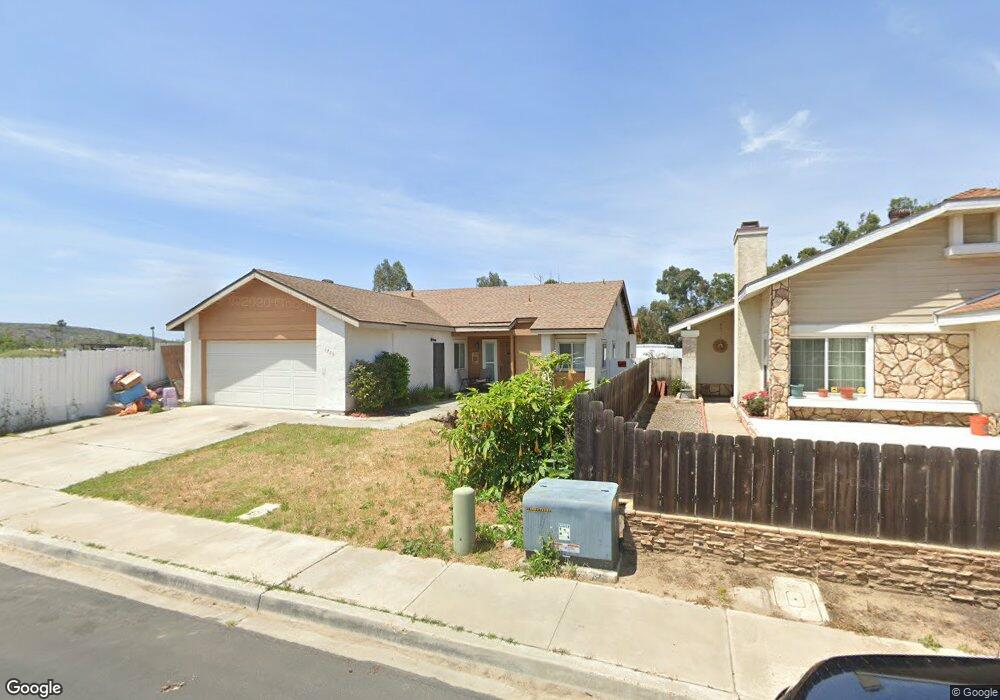
1780 Rodear Rd San Diego, CA 92154
Nestor NeighborhoodEstimated Value: $746,178 - $801,000
5
Beds
2
Baths
1,656
Sq Ft
$471/Sq Ft
Est. Value
About This Home
This home is located at 1780 Rodear Rd, San Diego, CA 92154 and is currently estimated at $779,545, approximately $470 per square foot. 1780 Rodear Rd is a home located in San Diego County with nearby schools including Godfrey G. Berry Elementary School, Mar Vista Academy, and Southwest Senior High School.
Ownership History
Date
Name
Owned For
Owner Type
Purchase Details
Closed on
Aug 27, 2009
Sold by
Oregan Terry and Dyer Terry
Bought by
Spence Marie Danna and Spence Robert Lee
Current Estimated Value
Home Financials for this Owner
Home Financials are based on the most recent Mortgage that was taken out on this home.
Original Mortgage
$273,762
Outstanding Balance
$178,036
Interest Rate
5.08%
Mortgage Type
VA
Estimated Equity
$601,509
Purchase Details
Closed on
Jul 15, 2009
Sold by
Morales Jimi and Morales Maria L
Bought by
Oregan Terry and Dyer Terry
Home Financials for this Owner
Home Financials are based on the most recent Mortgage that was taken out on this home.
Original Mortgage
$273,762
Outstanding Balance
$178,036
Interest Rate
5.08%
Mortgage Type
VA
Estimated Equity
$601,509
Purchase Details
Closed on
Jan 13, 1993
Bought by
Morales Jimi Maria L
Purchase Details
Closed on
Apr 27, 1990
Purchase Details
Closed on
Sep 18, 1984
Create a Home Valuation Report for This Property
The Home Valuation Report is an in-depth analysis detailing your home's value as well as a comparison with similar homes in the area
Home Values in the Area
Average Home Value in this Area
Purchase History
| Date | Buyer | Sale Price | Title Company |
|---|---|---|---|
| Spence Marie Danna | $268,000 | Fidelity National Title | |
| Dyer Terry | -- | Fidelity National Title | |
| Oregan Terry | $198,000 | None Available | |
| Morales Jimi Maria L | $142,000 | -- | |
| -- | $140,500 | -- | |
| -- | $90,000 | -- |
Source: Public Records
Mortgage History
| Date | Status | Borrower | Loan Amount |
|---|---|---|---|
| Open | Spence Marie Danna | $273,762 |
Source: Public Records
Tax History Compared to Growth
Tax History
| Year | Tax Paid | Tax Assessment Tax Assessment Total Assessment is a certain percentage of the fair market value that is determined by local assessors to be the total taxable value of land and additions on the property. | Land | Improvement |
|---|---|---|---|---|
| 2025 | $3,897 | $345,926 | $139,401 | $206,525 |
| 2024 | $3,897 | $339,144 | $136,668 | $202,476 |
| 2023 | $3,866 | $332,495 | $133,989 | $198,506 |
| 2022 | $3,791 | $325,976 | $131,362 | $194,614 |
| 2021 | $3,672 | $319,586 | $128,787 | $190,799 |
| 2020 | $3,586 | $316,310 | $127,467 | $188,843 |
| 2019 | $3,582 | $310,109 | $124,968 | $185,141 |
| 2018 | $3,520 | $304,029 | $122,518 | $181,511 |
| 2017 | $81 | $298,068 | $120,116 | $177,952 |
| 2016 | $3,326 | $292,224 | $117,761 | $174,463 |
| 2015 | $3,319 | $287,836 | $115,993 | $171,843 |
| 2014 | $3,263 | $282,198 | $113,721 | $168,477 |
Source: Public Records
Map
Nearby Homes
- 1693 Poesia Ct
- 2320 Tocayo Ave
- 1885 Leon Ave
- 1861 Katella St
- 2404 Tocayo Ave Unit 140
- 1793 Thelborn Way
- 0 No Address Available Unit PTP2506060
- 2123 Hemlock Ave
- 1759 Wolviston Way
- 1384 Frauline Dr
- 1805 Ionian St
- 2058 Toboggan Way
- 1562 Arequipa St
- 1421 Thermal Ave
- 1559 Hermes St
- 2180 Hofer Dr
- 1640 Halley St
- 1165 Hollister St Unit Space 26
- 1250 Caminito Cedro
- 1484-90 15th St
- 1770 Rodear Rd
- 1962 Rodear Rd
- 1760 Rodear Rd
- 2105 Madreselva Way
- 1750 Rodear Rd
- 2115 Madreselva Way
- 2125 Madreselva Way
- 2120 Madreselva Way
- 1728 Rodear Rd
- 2135 Madreselva Way
- 2130 Madreselva Way
- 1722 Rodear Rd
- 2145 Madreselva Way
- 1729 Rodear Rd
- 2140 Madreselva Way
- 1716 Rodear Rd
- 2155 Madreselva Way
- 1717 Rodear Rd
- 2150 Madreselva Way
- 1710 Rodear Rd