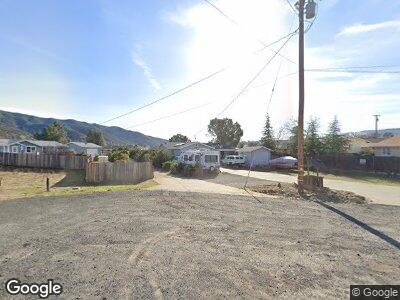
17807 Iris Way Clearlake Oaks, CA 95423
Estimated Value: $217,000 - $264,000
3
Beds
2
Baths
1,375
Sq Ft
$175/Sq Ft
Est. Value
About This Home
This home is located at 17807 Iris Way, Clearlake Oaks, CA 95423 and is currently estimated at $240,500, approximately $174 per square foot. 17807 Iris Way is a home located in Lake County with nearby schools including Lower Lake High School.
Ownership History
Date
Name
Owned For
Owner Type
Purchase Details
Closed on
Mar 27, 2015
Sold by
Neumiller Ken
Bought by
Soutos Brian P
Current Estimated Value
Home Financials for this Owner
Home Financials are based on the most recent Mortgage that was taken out on this home.
Original Mortgage
$69,515
Outstanding Balance
$54,528
Interest Rate
3.71%
Mortgage Type
New Conventional
Estimated Equity
$181,472
Purchase Details
Closed on
Jan 31, 2008
Sold by
Klinger Paul Anthony
Bought by
Neumiller Ken
Home Financials for this Owner
Home Financials are based on the most recent Mortgage that was taken out on this home.
Original Mortgage
$160,000
Interest Rate
6.17%
Mortgage Type
Seller Take Back
Purchase Details
Closed on
May 11, 2007
Sold by
Biller Christopher T and Biller Connie Marie M
Bought by
Klinger Paul Anthony
Purchase Details
Closed on
May 31, 2005
Sold by
White Niles L and White Beverly L
Bought by
Biller Christopher T and Biller Connie Marie M
Create a Home Valuation Report for This Property
The Home Valuation Report is an in-depth analysis detailing your home's value as well as a comparison with similar homes in the area
Home Values in the Area
Average Home Value in this Area
Purchase History
| Date | Buyer | Sale Price | Title Company |
|---|---|---|---|
| Soutos Brian P | $63,500 | First American Title Company | |
| Neumiller Ken | $175,000 | First American Title Company | |
| Klinger Paul Anthony | -- | None Available | |
| Biller Christopher T | -- | First American Title |
Source: Public Records
Mortgage History
| Date | Status | Borrower | Loan Amount |
|---|---|---|---|
| Open | Soutos Brian P | $69,515 | |
| Previous Owner | Neumiller Ken | $160,000 |
Source: Public Records
Tax History Compared to Growth
Tax History
| Year | Tax Paid | Tax Assessment Tax Assessment Total Assessment is a certain percentage of the fair market value that is determined by local assessors to be the total taxable value of land and additions on the property. | Land | Improvement |
|---|---|---|---|---|
| 2024 | $1,980 | $176,734 | $29,453 | $147,281 |
| 2023 | $1,957 | $173,270 | $28,876 | $144,394 |
| 2022 | $1,861 | $169,873 | $28,310 | $141,563 |
| 2021 | $1,917 | $166,543 | $27,755 | $138,788 |
| 2020 | $1,907 | $164,836 | $27,471 | $137,365 |
| 2019 | $1,825 | $161,605 | $26,933 | $134,672 |
| 2018 | $1,826 | $158,437 | $26,405 | $132,032 |
| 2017 | $1,738 | $155,332 | $25,888 | $129,444 |
| 2016 | $1,738 | $152,287 | $25,381 | $126,906 |
| 2015 | $2,158 | $191,256 | $49,179 | $142,077 |
| 2014 | $2,583 | $187,510 | $48,216 | $139,294 |
Source: Public Records
Map
Nearby Homes
- 2360 Spring Valley Rd
- 2442 River View Rd
- 1992 River View Rd
- 2627 River View Rd
- 2564 Indian Hill Rd
- 2109 Indian Hill Rd
- 2824 Spring Valley Rd
- 17216 Cedar Way
- 1996 River View Rd
- 1845 Spring Valley Rd
- 2986 Quince Way
- 2940 Blackfeet Trail
- 16730 Comanche Trail
- 3289 Wolf Creek Rd
- 3165 Spring Valley Rd
- 3144 Spring Valley Rd
- 15709 Cache Creek Rd
- 3182 Tamarack Way
- 2655 Spring Valley Rd
- 1760 Spring Valley Rd
- 17807 Iris Way
- 2536 Spring Valley Rd
- 17827 Iris Way
- 17802 Iris Way
- 2524 Spring Valley Rd
- 17837 Iris Way
- 17706 Holly Way
- 2560 Spring Valley Rd
- 17822 Iris Way
- 17726 Holly Way
- 2888 Meadow Creek Rd
- 17812 Iris Way
- 2535 Spring Valley Rd
- 2904 Meadow Creek Rd
- 17701 Holly Way
- 2584 Spring Valley Rd
- 17721 Holly Way
- 17903 Juniper Way
- 17923 Juniper Way
- 17711 Holly Way