Estimated Value: $457,000 - $568,000
3
Beds
2
Baths
1,328
Sq Ft
$392/Sq Ft
Est. Value
About This Home
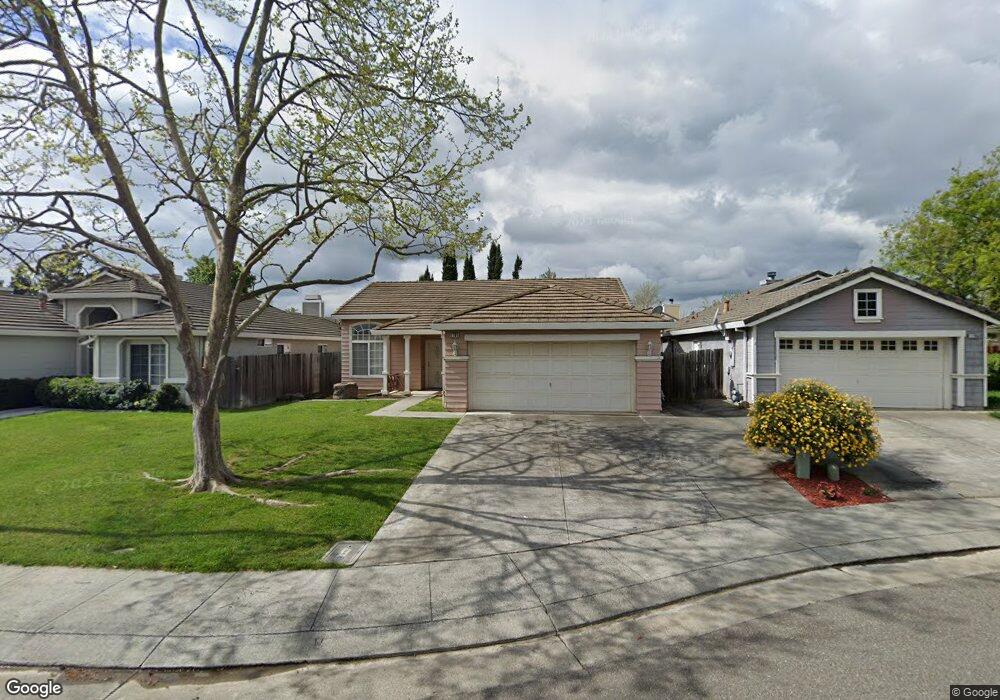
This home is located at 1785 Winfield St, Dixon, CA 95620 and is currently estimated at $520,019, approximately $391 per square foot. 1785 Winfield St is a home located in Solano County with nearby schools including Tremont Elementary School, Dixon High School, and Dixon Montessori Charter.
Ownership History
Date
Name
Owned For
Owner Type
Purchase Details
Closed on
Apr 17, 2020
Sold by
Moritomo Gregory J
Bought by
Moritomo Gregory J and Moritomo Gregory John
Current Estimated Value
Purchase Details
Closed on
Mar 12, 2002
Sold by
Hernandez Laura A
Bought by
Moritomo Gregory J
Home Financials for this Owner
Home Financials are based on the most recent Mortgage that was taken out on this home.
Original Mortgage
$229,000
Outstanding Balance
$99,286
Interest Rate
7.75%
Estimated Equity
$420,733
Purchase Details
Closed on
Apr 1, 1999
Sold by
Eichenberg John B and Eichenberg Laura A
Bought by
Hernandez Laura A
Home Financials for this Owner
Home Financials are based on the most recent Mortgage that was taken out on this home.
Original Mortgage
$124,500
Interest Rate
7.1%
Create a Home Valuation Report for This Property
The Home Valuation Report is an in-depth analysis detailing your home's value as well as a comparison with similar homes in the area
Home Values in the Area
Average Home Value in this Area
Purchase History
| Date | Buyer | Sale Price | Title Company |
|---|---|---|---|
| Moritomo Gregory J | -- | None Available | |
| Moritomo Gregory J | $229,000 | Chicago Title Co | |
| Hernandez Laura A | -- | North American Title Co |
Source: Public Records
Mortgage History
| Date | Status | Borrower | Loan Amount |
|---|---|---|---|
| Open | Moritomo Gregory J | $229,000 | |
| Previous Owner | Hernandez Laura A | $124,500 |
Source: Public Records
Tax History
| Year | Tax Paid | Tax Assessment Tax Assessment Total Assessment is a certain percentage of the fair market value that is determined by local assessors to be the total taxable value of land and additions on the property. | Land | Improvement |
|---|---|---|---|---|
| 2025 | $3,983 | $343,610 | $96,018 | $247,592 |
| 2024 | $3,983 | $336,874 | $94,136 | $242,738 |
| 2023 | $3,867 | $330,270 | $92,291 | $237,979 |
| 2022 | $3,811 | $323,795 | $90,482 | $233,313 |
| 2021 | $3,764 | $317,447 | $88,708 | $228,739 |
| 2020 | $3,704 | $314,193 | $87,799 | $226,394 |
| 2019 | $3,635 | $308,033 | $86,078 | $221,955 |
| 2018 | $3,620 | $301,994 | $84,391 | $217,603 |
| 2017 | $3,531 | $296,074 | $82,737 | $213,337 |
| 2016 | $3,379 | $290,269 | $81,115 | $209,154 |
| 2015 | $3,303 | $285,910 | $79,897 | $206,013 |
| 2014 | $3,208 | $277,000 | $64,000 | $213,000 |
Source: Public Records
Map
Nearby Homes
- 690 Woodard Way
- 1825 Whiting Ct
- 1845 Derby Dr
- 1365 Jacobs Place
- 2035 Rehrmann Dr
- 1315 Jacobs Place
- 1135 Dawson Dr
- 550 N Lincoln St
- 1320 Angela Ct
- 775 Cahill Ct
- 795 Michele Ct
- 1150 Mulberry Ln
- 1330 Blackberry Ct
- 905 W F St
- 1155 Mulberry Ln
- 1250 Redwood Ct
- 525 Fruit Tree Rd
- 1310 Hawthorne Ct
- 2100 Lark Way
- 1770 Butterfly Ln
Your Personal Tour Guide
Ask me questions while you tour the home.