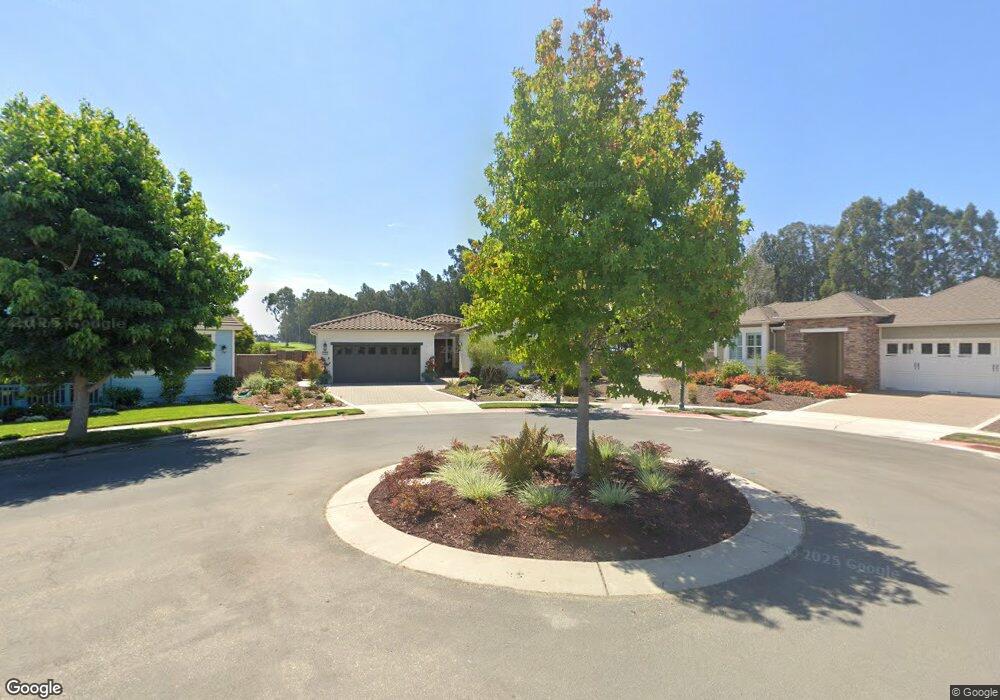
1787 Trilogy Pkwy Nipomo, CA 93444
Woodlands NeighborhoodEstimated Value: $1,226,473 - $1,510,000
2
Beds
2
Baths
2,058
Sq Ft
$671/Sq Ft
Est. Value
About This Home
This home is located at 1787 Trilogy Pkwy, Nipomo, CA 93444 and is currently estimated at $1,381,618, approximately $671 per square foot. 1787 Trilogy Pkwy is a home located in San Luis Obispo County with nearby schools including Dorothea Lange Elementary School, Mesa Middle School, and Nipomo High School.
Ownership History
Date
Name
Owned For
Owner Type
Purchase Details
Closed on
Oct 19, 2012
Sold by
Sleeth Betty Jean
Bought by
Sleeth Betty Jean R
Current Estimated Value
Purchase Details
Closed on
Mar 24, 2011
Sold by
Mcgrew Randolph W and Mcgrew Julie A
Bought by
Sleeth Betty Jean
Home Financials for this Owner
Home Financials are based on the most recent Mortgage that was taken out on this home.
Original Mortgage
$100,000
Outstanding Balance
$37,643
Interest Rate
4.83%
Mortgage Type
New Conventional
Estimated Equity
$1,343,975
Purchase Details
Closed on
Nov 10, 2006
Sold by
Shea Homes Lp
Bought by
Mcgrew Randolph W and Mcgrew Julie A
Home Financials for this Owner
Home Financials are based on the most recent Mortgage that was taken out on this home.
Original Mortgage
$417,000
Interest Rate
6.37%
Mortgage Type
Purchase Money Mortgage
Create a Home Valuation Report for This Property
The Home Valuation Report is an in-depth analysis detailing your home's value as well as a comparison with similar homes in the area
Home Values in the Area
Average Home Value in this Area
Purchase History
| Date | Buyer | Sale Price | Title Company |
|---|---|---|---|
| Sleeth Betty Jean R | -- | None Available | |
| Sleeth Betty Jean | $575,000 | Fidelity National Title Co | |
| Mcgrew Randolph W | $912,500 | First American Title Co |
Source: Public Records
Mortgage History
| Date | Status | Borrower | Loan Amount |
|---|---|---|---|
| Open | Sleeth Betty Jean | $100,000 | |
| Previous Owner | Mcgrew Randolph W | $417,000 |
Source: Public Records
Tax History
| Year | Tax Paid | Tax Assessment Tax Assessment Total Assessment is a certain percentage of the fair market value that is determined by local assessors to be the total taxable value of land and additions on the property. | Land | Improvement |
|---|---|---|---|---|
| 2025 | $7,504 | $736,664 | $403,563 | $333,101 |
| 2024 | $7,416 | $722,220 | $395,650 | $326,570 |
| 2023 | $7,416 | $708,060 | $387,893 | $320,167 |
| 2022 | $7,303 | $694,178 | $380,288 | $313,890 |
| 2021 | $7,288 | $680,568 | $372,832 | $307,736 |
| 2020 | $7,204 | $673,591 | $369,010 | $304,581 |
| 2019 | $7,158 | $660,384 | $361,775 | $298,609 |
| 2018 | $7,072 | $647,436 | $354,682 | $292,754 |
| 2017 | $6,938 | $634,742 | $347,728 | $287,014 |
| 2016 | $6,542 | $622,297 | $340,910 | $281,387 |
| 2015 | $6,447 | $612,951 | $335,790 | $277,161 |
| 2014 | $6,206 | $600,945 | $329,213 | $271,732 |
Source: Public Records
Map
Nearby Homes
- 1958 Eucalyptus Rd
- 1695 Trilogy Pkwy
- 1705 Louise Ln
- 1788 Louise Ln
- 1155 Spring Azure Way
- 1772 Waterview Place
- 1189 Swallowtail Way
- 1658 Waterview Place
- 957 Jacqueline Place
- 1642 Northwood Rd
- 1155 Aj Ln
- 1590 Eucalyptus Rd
- 1175 Danielle Ct
- 1471 Via Vista
- 1564 Eucalyptus Rd
- 1520 California 1
- 1335 Silvia Ln
- 1535 Eucalyptus Rd
- 1066 Trail View Place
- 981 Trail View Place
- 1785 Trilogy Pkwy Unit PY
- 1788 Trilogy Pkwy
- 1988 Eucalyptus Rd
- 1784 Trilogy Pkwy
- 1978 Eucalyptus Rd
- 1782 Trilogy Pkwy Unit PY
- 1968 Eucalyptus Rd
- 1769 Trilogy Pkwy
- 1989 Eucalyptus Rd Unit 1
- 1994 Northwood Rd
- 1979 Eucalyptus Rd
- 1768 Trilogy Pkwy
- 1984 Northwood Rd
- 1765 Trilogy Pkwy
- 1948 Eucalyptus Rd
- 1995 Northwood Rd
- 1786 Kyle Ct
- 1764 Trilogy Pkwy Unit PY
Your Personal Tour Guide
Ask me questions while you tour the home.