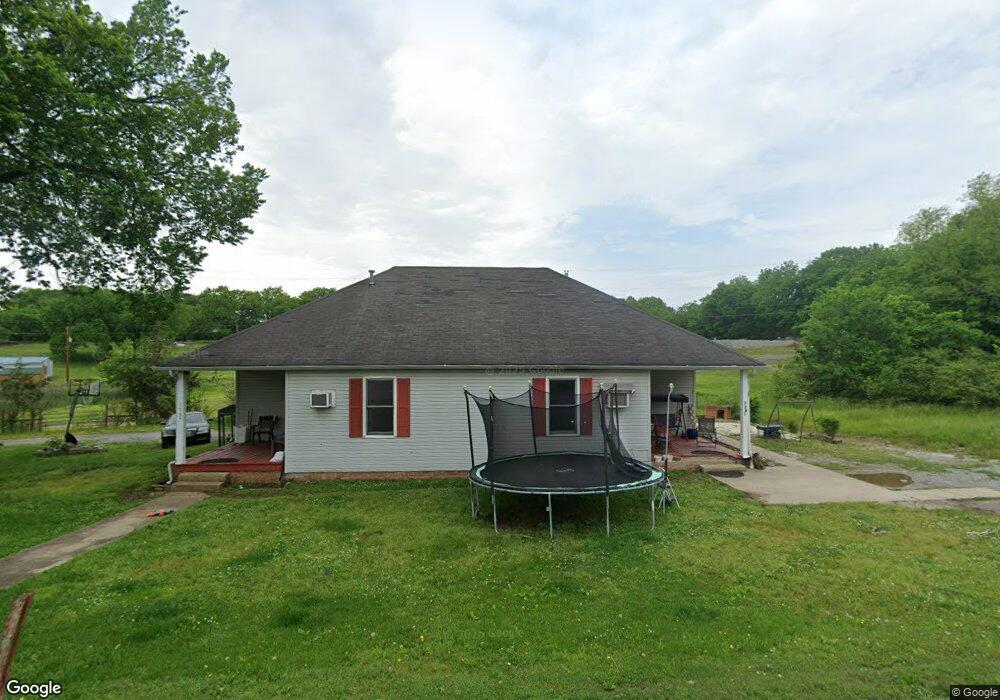
178A Cedar River Rd Shelbyville, TN 37160
Estimated Value: $129,000 - $366,000
--
Bed
2
Baths
1,562
Sq Ft
$158/Sq Ft
Est. Value
About This Home
This home is located at 178A Cedar River Rd, Shelbyville, TN 37160 and is currently estimated at $247,500, approximately $158 per square foot. 178A Cedar River Rd is a home located in Bedford County with nearby schools including South Side Elementary School, Harris Middle School, and Christian Chapel Academy.
Ownership History
Date
Name
Owned For
Owner Type
Purchase Details
Closed on
Dec 28, 2012
Sold by
Flippo Steven
Bought by
Mcgee Bradley Davis and Fisher Michael Brett
Current Estimated Value
Home Financials for this Owner
Home Financials are based on the most recent Mortgage that was taken out on this home.
Original Mortgage
$73,000
Outstanding Balance
$50,553
Interest Rate
3.36%
Mortgage Type
Commercial
Estimated Equity
$196,947
Purchase Details
Closed on
Apr 7, 2009
Sold by
Atkins Charles P
Bought by
Flippo Steven
Home Financials for this Owner
Home Financials are based on the most recent Mortgage that was taken out on this home.
Original Mortgage
$46,800
Interest Rate
5.05%
Purchase Details
Closed on
Jun 15, 2001
Bought by
Atkins Charles P
Purchase Details
Closed on
Mar 15, 1999
Sold by
Farrar Thomas Paul
Bought by
Farrar James E
Purchase Details
Closed on
Jul 29, 1988
Bought by
Davis Arthur E
Purchase Details
Closed on
Jun 13, 1986
Bought by
Leverette Gary L
Create a Home Valuation Report for This Property
The Home Valuation Report is an in-depth analysis detailing your home's value as well as a comparison with similar homes in the area
Home Values in the Area
Average Home Value in this Area
Purchase History
| Date | Buyer | Sale Price | Title Company |
|---|---|---|---|
| Mcgee Bradley Davis | $93,000 | -- | |
| Flippo Steven | $46,800 | -- | |
| Atkins Charles P | $65,000 | -- | |
| Farrar James E | $25,801 | -- | |
| Davis Arthur E | -- | -- | |
| Leverette Gary L | -- | -- |
Source: Public Records
Mortgage History
| Date | Status | Borrower | Loan Amount |
|---|---|---|---|
| Open | Mcgee Bradley Davis | $73,000 | |
| Previous Owner | Leverette Gary L | $46,800 |
Source: Public Records
Tax History Compared to Growth
Tax History
| Year | Tax Paid | Tax Assessment Tax Assessment Total Assessment is a certain percentage of the fair market value that is determined by local assessors to be the total taxable value of land and additions on the property. | Land | Improvement |
|---|---|---|---|---|
| 2025 | -- | $38,600 | $0 | $0 |
| 2024 | -- | $38,600 | $4,200 | $34,400 |
| 2023 | $1,469 | $38,600 | $4,200 | $34,400 |
| 2022 | $1,512 | $38,600 | $4,200 | $34,400 |
| 2021 | $1,373 | $38,600 | $4,200 | $34,400 |
| 2020 | $760 | $38,600 | $4,200 | $34,400 |
| 2019 | $760 | $17,160 | $2,800 | $14,360 |
| 2018 | $743 | $17,160 | $2,800 | $14,360 |
| 2017 | $743 | $17,160 | $2,800 | $14,360 |
| 2016 | $736 | $17,160 | $2,800 | $14,360 |
| 2015 | $736 | $17,160 | $2,800 | $14,360 |
| 2014 | $658 | $16,792 | $0 | $0 |
Source: Public Records
Map
Nearby Homes
- 201 Shelbyville Mills Rd
- 146 Tanner Cir
- 144 Tanner Cir
- 105 Fairway Green
- 142 Tanner Cir
- 181 Hendon Memorial Rd
- 1204 W Lane St
- 100 Baker St
- 115 W End Cir
- 111 Parker Rd
- 108 Demombreum Cir
- 112 N Linda Dr
- 109 Demombreum Cir
- 112 Demombreum Cir
- 100 Demombreum Cir
- 101 Briar Patch Dr
- 111 Demonbreum Cir
- 107 Demonbreum Cir
- 110 Demonbreum Cir
- 106 Demonbreum Cir
- 178A Cedar River Rd
- 176 A B Cedar Grove Rd
- 177A Cedar River Rd
- 178 Cedar Grove Rd
- 175A Cedar Grove Rd Unit B
- 202 Cedar River Rd
- 179 Cedar Grove Rd
- 180A Cedar Grove Rd Unit B
- 180 Cedar Grove Rd
- 179A Cedar Grove Rd Unit B
- 203 Cedar River Rd
- 172 Cedar River Rd
- 182 Cedar Grove Rd
- 181A Cedar Grove Rd Unit B
- 171 Cedar Grove Rd
- 181 Cedar Grove Rd
- 170A Cedar River Rd
- 205 Cedar River Rd
- 1208 W Jackson St
- 168 A B Cedar Grove Rd