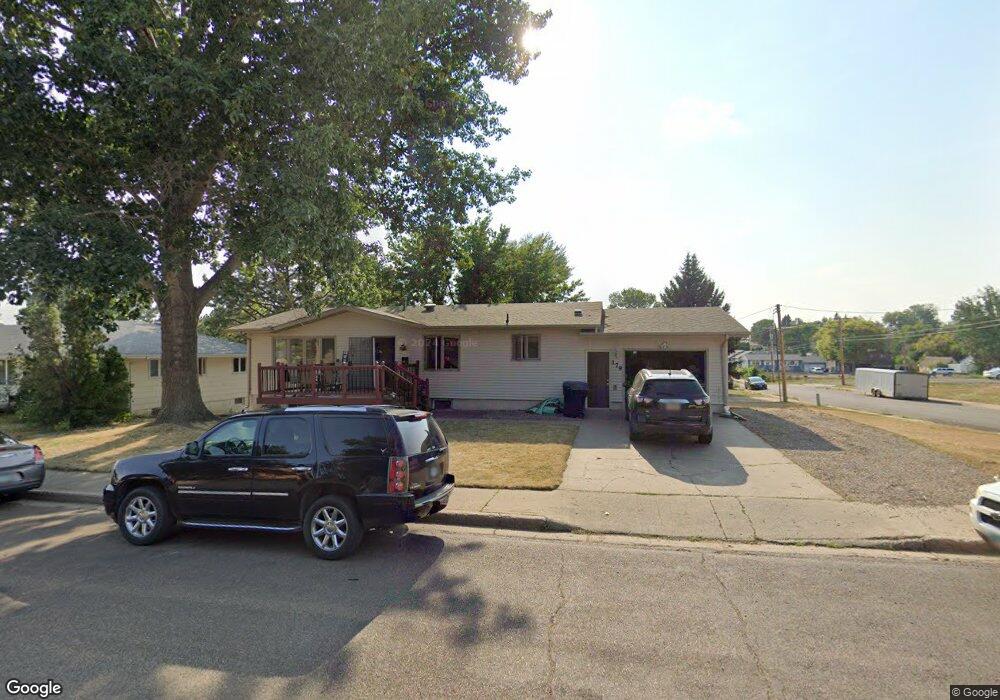
179 9th Ave E Dickinson, ND 58601
Estimated Value: $318,000 - $352,000
5
Beds
1
Bath
1,288
Sq Ft
$258/Sq Ft
Est. Value
About This Home
This home is located at 179 9th Ave E, Dickinson, ND 58601 and is currently estimated at $332,471, approximately $258 per square foot. 179 9th Ave E is a home located in Stark County with nearby schools including Trinity Elementary School West, Trinity Elementary School East, and St. Joseph School.
Ownership History
Date
Name
Owned For
Owner Type
Purchase Details
Closed on
Nov 13, 2024
Sold by
Scheeler Joyce
Bought by
Scheeler Douglas and Scheeler Wayne
Current Estimated Value
Purchase Details
Closed on
Nov 5, 2015
Sold by
Brandt Allan F
Bought by
Eilts Robert and Eilts Jennifer
Home Financials for this Owner
Home Financials are based on the most recent Mortgage that was taken out on this home.
Original Mortgage
$250,381
Interest Rate
3.74%
Mortgage Type
FHA
Create a Home Valuation Report for This Property
The Home Valuation Report is an in-depth analysis detailing your home's value as well as a comparison with similar homes in the area
Home Values in the Area
Average Home Value in this Area
Purchase History
| Date | Buyer | Sale Price | Title Company |
|---|---|---|---|
| Scheeler Douglas | -- | None Listed On Document | |
| Scheeler Douglas | -- | None Listed On Document | |
| Eilts Robert | -- | First Dakota Title |
Source: Public Records
Mortgage History
| Date | Status | Borrower | Loan Amount |
|---|---|---|---|
| Previous Owner | Eilts Robert | $250,381 |
Source: Public Records
Tax History
| Year | Tax Paid | Tax Assessment Tax Assessment Total Assessment is a certain percentage of the fair market value that is determined by local assessors to be the total taxable value of land and additions on the property. | Land | Improvement |
|---|---|---|---|---|
| 2025 | $1,672 | $261,000 | $30,000 | $231,000 |
| 2024 | $2,718 | $261,000 | $30,000 | $231,000 |
| 2023 | $2,575 | $261,000 | $30,000 | $231,000 |
| 2022 | $2,438 | $122,550 | $0 | $0 |
| 2021 | $2,378 | $231,200 | $30,000 | $201,200 |
| 2020 | $2,411 | $231,200 | $30,000 | $201,200 |
| 2019 | $2,418 | $231,200 | $30,000 | $201,200 |
| 2017 | $1,732 | $241,900 | $30,000 | $211,900 |
| 2015 | $1,732 | $197,800 | $17,300 | $180,500 |
| 2014 | $1,804 | $190,800 | $17,300 | $173,500 |
| 2013 | -- | $183,900 | $17,300 | $166,600 |
Source: Public Records
Map
Nearby Homes
Your Personal Tour Guide
Ask me questions while you tour the home.