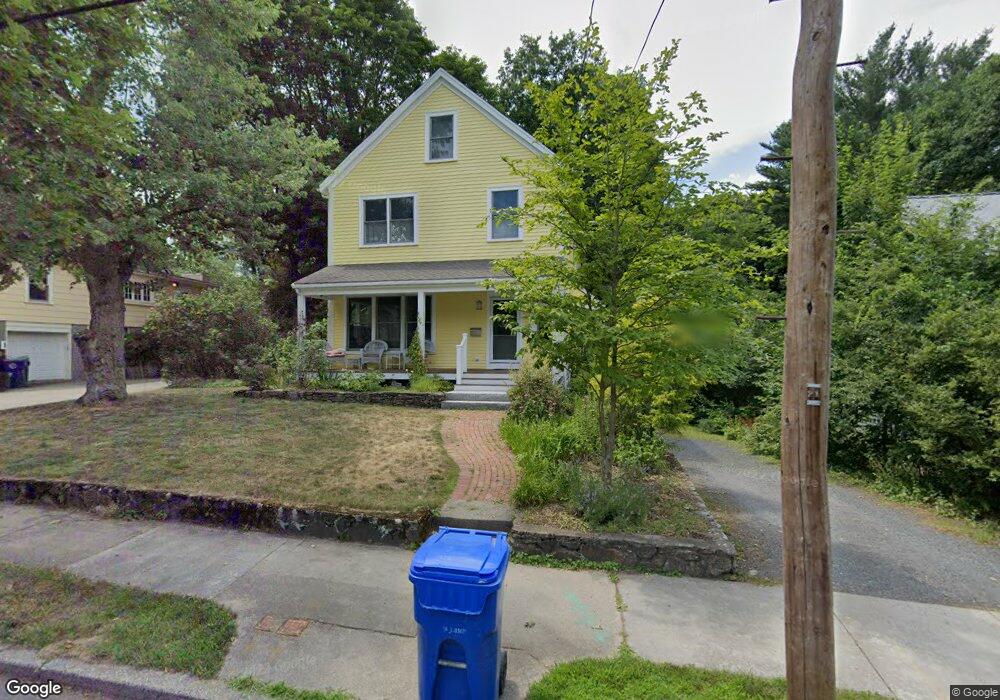
179 Allen Ave Waban, MA 02468
Waban NeighborhoodEstimated Value: $1,664,000 - $2,591,000
4
Beds
3
Baths
2,266
Sq Ft
$907/Sq Ft
Est. Value
About This Home
This home is located at 179 Allen Ave, Waban, MA 02468 and is currently estimated at $2,055,076, approximately $906 per square foot. 179 Allen Ave is a home located in Middlesex County with nearby schools including Zervas Elementary School, Oak Hill Middle School, and Newton South High School.
Ownership History
Date
Name
Owned For
Owner Type
Purchase Details
Closed on
Mar 28, 2024
Sold by
Sinclair Kenneth H and Blagdon Mary E
Bought by
Mary Elisabeth Blagdon Ft and Blagdon
Current Estimated Value
Purchase Details
Closed on
Jun 28, 1991
Sold by
Thomas Harry B
Bought by
Sinclair Kenneth H
Home Financials for this Owner
Home Financials are based on the most recent Mortgage that was taken out on this home.
Original Mortgage
$28,700
Interest Rate
9.44%
Mortgage Type
Purchase Money Mortgage
Purchase Details
Closed on
Sep 15, 1987
Sold by
Mccarthy Flor Est
Bought by
Thomas Harry B
Create a Home Valuation Report for This Property
The Home Valuation Report is an in-depth analysis detailing your home's value as well as a comparison with similar homes in the area
Home Values in the Area
Average Home Value in this Area
Purchase History
| Date | Buyer | Sale Price | Title Company |
|---|---|---|---|
| Mary Elisabeth Blagdon Ft | -- | None Available | |
| Mary Elisabeth Blagdon Ft | -- | None Available | |
| Sinclair Kenneth H | $300,000 | -- | |
| Sinclair Kenneth H | $300,000 | -- | |
| Thomas Harry B | $262,000 | -- |
Source: Public Records
Mortgage History
| Date | Status | Borrower | Loan Amount |
|---|---|---|---|
| Previous Owner | Thomas Harry B | $250,000 | |
| Previous Owner | Thomas Harry B | $180,000 | |
| Previous Owner | Thomas Harry B | $28,700 |
Source: Public Records
Tax History Compared to Growth
Tax History
| Year | Tax Paid | Tax Assessment Tax Assessment Total Assessment is a certain percentage of the fair market value that is determined by local assessors to be the total taxable value of land and additions on the property. | Land | Improvement |
|---|---|---|---|---|
| 2025 | $16,688 | $1,702,900 | $1,262,000 | $440,900 |
| 2024 | $16,136 | $1,653,300 | $1,225,200 | $428,100 |
| 2023 | $15,210 | $1,494,100 | $952,800 | $541,300 |
| 2022 | $14,553 | $1,383,400 | $882,200 | $501,200 |
| 2021 | $14,043 | $1,305,100 | $832,300 | $472,800 |
| 2020 | $13,625 | $1,305,100 | $832,300 | $472,800 |
| 2019 | $13,241 | $1,267,100 | $808,100 | $459,000 |
| 2018 | $12,536 | $1,158,600 | $729,200 | $429,400 |
| 2017 | $12,154 | $1,093,000 | $687,900 | $405,100 |
| 2016 | $11,625 | $1,021,500 | $642,900 | $378,600 |
| 2015 | $11,084 | $954,700 | $600,800 | $353,900 |
Source: Public Records
Map
Nearby Homes
- 80 Pine Ridge Rd
- 120 Stanley Rd
- 131 Oliver Rd
- 35 Bradford Rd
- 25 Allen Ave
- 1430 Beacon St
- 35 Kingston Rd
- 873 Chestnut St
- 120 Collins Rd
- 29 Montclair Rd
- 18 Annawan Rd
- 200 Lincoln St
- 20 Kinmonth Rd Unit 203
- 20 Kinmonth Rd Unit 306
- 1077 Boylston St
- 513 Chestnut St
- 17 Circuit Ave Unit 2
- 115 Windsor Rd
- 103 Thurston Rd
- 3 Glenmore Terrace Unit 2