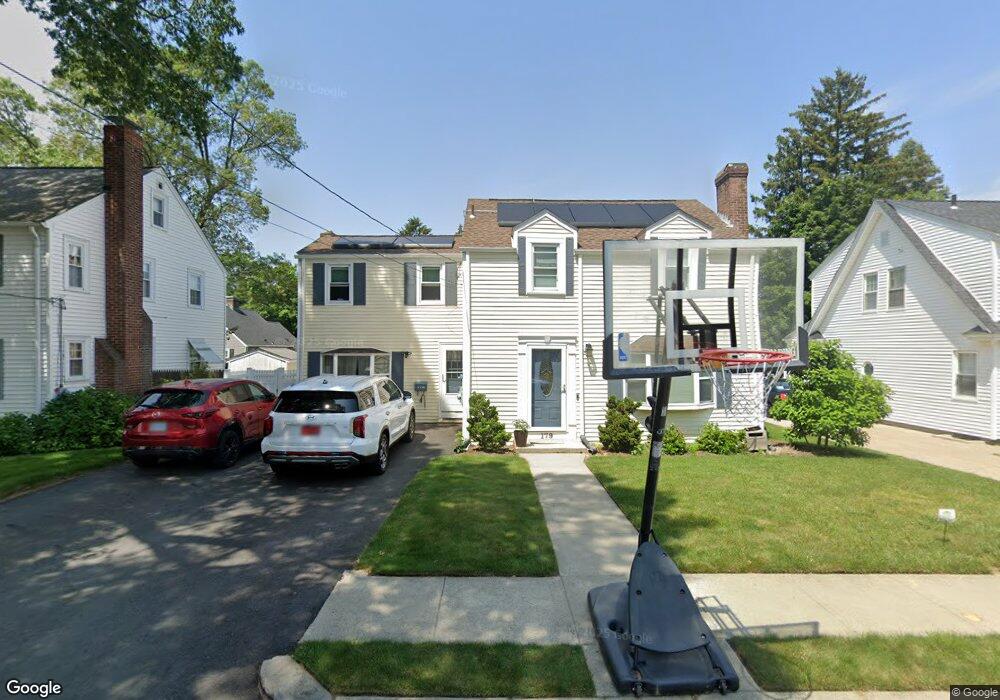
179 Calaman Rd Cranston, RI 02910
Forest Hills NeighborhoodEstimated Value: $438,000 - $456,000
3
Beds
2
Baths
2,134
Sq Ft
$210/Sq Ft
Est. Value
About This Home
This home is located at 179 Calaman Rd, Cranston, RI 02910 and is currently estimated at $447,567, approximately $209 per square foot. 179 Calaman Rd is a home located in Providence County with nearby schools including Woodridge Elementary School, Western Hills Middle School, and Cranston High School West.
Ownership History
Date
Name
Owned For
Owner Type
Purchase Details
Closed on
May 15, 2018
Sold by
Thomas L Maclean Jr Ft and Dodez James S
Bought by
Manzi Michael J and Manzi Jennifer C
Current Estimated Value
Home Financials for this Owner
Home Financials are based on the most recent Mortgage that was taken out on this home.
Original Mortgage
$227,950
Outstanding Balance
$196,033
Interest Rate
4.44%
Mortgage Type
Purchase Money Mortgage
Estimated Equity
$251,534
Purchase Details
Closed on
Jan 6, 2009
Sold by
Mandeville George
Bought by
Maclean Joyce and Maclean Thomas
Home Financials for this Owner
Home Financials are based on the most recent Mortgage that was taken out on this home.
Original Mortgage
$145,000
Interest Rate
6.08%
Mortgage Type
Purchase Money Mortgage
Purchase Details
Closed on
Oct 8, 2008
Sold by
Bank Of New York
Bought by
Mandeville George
Purchase Details
Closed on
Oct 2, 2008
Sold by
Greaves David and Greaves Holly
Bought by
Bank Of New York
Purchase Details
Closed on
Feb 22, 2001
Sold by
Gomes Richard A
Bought by
Greaves David A and Greaves Holly
Create a Home Valuation Report for This Property
The Home Valuation Report is an in-depth analysis detailing your home's value as well as a comparison with similar homes in the area
Home Values in the Area
Average Home Value in this Area
Purchase History
| Date | Buyer | Sale Price | Title Company |
|---|---|---|---|
| Manzi Michael J | $235,000 | -- | |
| Thomas L Maclean Jr Ft | -- | -- | |
| Maclean Joyce | $225,000 | -- | |
| Mandeville George | $141,000 | -- | |
| Bank Of New York | $137,000 | -- | |
| Greaves David A | $138,000 | -- |
Source: Public Records
Mortgage History
| Date | Status | Borrower | Loan Amount |
|---|---|---|---|
| Open | Greaves David A | $227,950 | |
| Previous Owner | Greaves David A | $145,000 |
Source: Public Records
Tax History Compared to Growth
Tax History
| Year | Tax Paid | Tax Assessment Tax Assessment Total Assessment is a certain percentage of the fair market value that is determined by local assessors to be the total taxable value of land and additions on the property. | Land | Improvement |
|---|---|---|---|---|
| 2025 | $4,986 | $359,200 | $102,000 | $257,200 |
| 2024 | $4,889 | $359,200 | $102,000 | $257,200 |
| 2023 | $4,899 | $259,200 | $70,400 | $188,800 |
| 2022 | $4,798 | $259,200 | $70,400 | $188,800 |
| 2021 | $4,666 | $259,200 | $70,400 | $188,800 |
| 2020 | $4,671 | $224,900 | $73,700 | $151,200 |
| 2019 | $4,671 | $224,900 | $73,700 | $151,200 |
| 2018 | $4,563 | $224,900 | $73,700 | $151,200 |
| 2017 | $4,735 | $206,400 | $67,000 | $139,400 |
| 2016 | $4,634 | $206,400 | $67,000 | $139,400 |
| 2015 | $4,634 | $206,400 | $67,000 | $139,400 |
| 2014 | $4,426 | $193,800 | $67,000 | $126,800 |
Source: Public Records
Map
Nearby Homes
- 55 Columbus Blvd
- 46 Roslyn Ave
- 12 Stevens Rd
- 63 Packard St
- 80 Packard St
- 130 Wollaston St
- 111 Belgium St
- 74 Leslie St
- 210 Crescent Ave
- 115 Norfolk St
- 140 Concord Ave
- 0 Fiat Ave
- 174 Gansett Ave
- 166 Midwood St
- 145 Harmon Ave
- 51 Norfolk St
- 41 Gleason St
- 75 High School Ave
- 136 Frankfort St
- 92 Rhode Island St
- 183 Calaman Rd
- 175 Calaman Rd
- 160 Columbus Blvd
- 91 Ausdale Rd
- 171 Calaman Rd
- 180 Calaman Rd
- 184 Calaman Rd
- 176 Calaman Rd
- 167 Calaman Rd
- 172 Calaman Rd
- 188 Calaman Rd
- 90 Ausdale Rd
- 157 Columbus Blvd
- 163 Calaman Rd
- 168 Calaman Rd
- 127 Ausdale Rd
- 151 Columbus Blvd
- 84 Ausdale Rd
- 109 Knollwood Ave
- 199 Calaman Rd