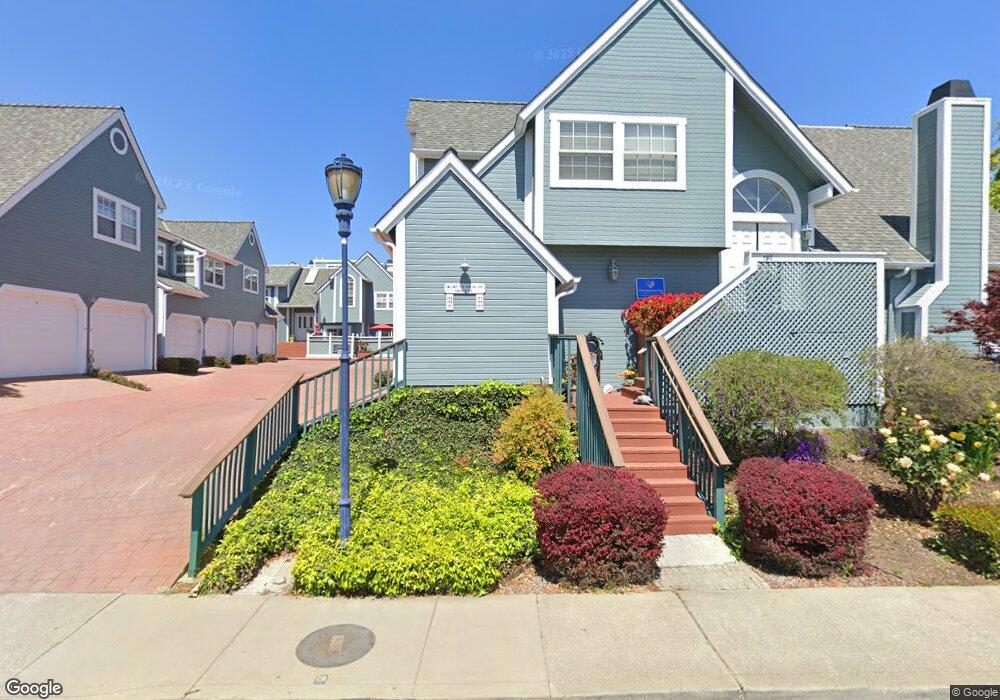
179 E B St Unit 31 Benicia, CA 94510
Estimated Value: $611,000 - $724,000
2
Beds
3
Baths
1,370
Sq Ft
$488/Sq Ft
Est. Value
About This Home
This home is located at 179 E B St Unit 31, Benicia, CA 94510 and is currently estimated at $668,208, approximately $487 per square foot. 179 E B St Unit 31 is a home located in Solano County with nearby schools including Mary Farmar Elementary School, Benicia Middle School, and Benicia High School.
Ownership History
Date
Name
Owned For
Owner Type
Purchase Details
Closed on
Mar 15, 2010
Sold by
Pointe Benicia Ventures Llc
Bought by
Vertical Ventures Pointe Benicia Llc
Current Estimated Value
Purchase Details
Closed on
Nov 30, 2009
Sold by
Vertical Ventures Pointe Benicia Llc
Bought by
Buck Gordon Susan Barbara
Home Financials for this Owner
Home Financials are based on the most recent Mortgage that was taken out on this home.
Original Mortgage
$203,500
Interest Rate
4.78%
Mortgage Type
FHA
Purchase Details
Closed on
Mar 23, 1994
Sold by
Syme Charles W and Syme Claudette J
Bought by
Sargent Hugh H and Sargent Geraldine D
Home Financials for this Owner
Home Financials are based on the most recent Mortgage that was taken out on this home.
Original Mortgage
$89,000
Interest Rate
4.1%
Create a Home Valuation Report for This Property
The Home Valuation Report is an in-depth analysis detailing your home's value as well as a comparison with similar homes in the area
Home Values in the Area
Average Home Value in this Area
Purchase History
| Date | Buyer | Sale Price | Title Company |
|---|---|---|---|
| Vertical Ventures Pointe Benicia Llc | -- | First American Title Insuran | |
| Buck Gordon Susan Barbara | $360,000 | Fidelity National Title Co | |
| Sargent Hugh H | $72,000 | First Amer Title Guaranty Co |
Source: Public Records
Mortgage History
| Date | Status | Borrower | Loan Amount |
|---|---|---|---|
| Previous Owner | Buck Gordon Susan Barbara | $203,500 | |
| Previous Owner | Sargent Hugh H | $89,000 |
Source: Public Records
Tax History
| Year | Tax Paid | Tax Assessment Tax Assessment Total Assessment is a certain percentage of the fair market value that is determined by local assessors to be the total taxable value of land and additions on the property. | Land | Improvement |
|---|---|---|---|---|
| 2025 | $5,365 | $464,557 | $116,169 | $348,388 |
| 2024 | $5,365 | $455,449 | $113,892 | $341,557 |
| 2023 | $5,235 | $446,519 | $111,659 | $334,860 |
| 2022 | $5,136 | $437,765 | $109,470 | $328,295 |
| 2021 | $5,030 | $429,182 | $107,324 | $321,858 |
| 2020 | $4,962 | $424,782 | $106,224 | $318,558 |
| 2019 | $4,875 | $416,454 | $104,142 | $312,312 |
| 2018 | $4,748 | $408,289 | $102,100 | $306,189 |
| 2017 | $4,637 | $400,285 | $100,099 | $300,186 |
| 2016 | $4,673 | $392,437 | $98,137 | $294,300 |
| 2015 | $4,553 | $386,543 | $96,663 | $289,880 |
| 2014 | $4,498 | $378,972 | $94,770 | $284,202 |
Source: Public Records
Map
Nearby Homes
Your Personal Tour Guide
Ask me questions while you tour the home.