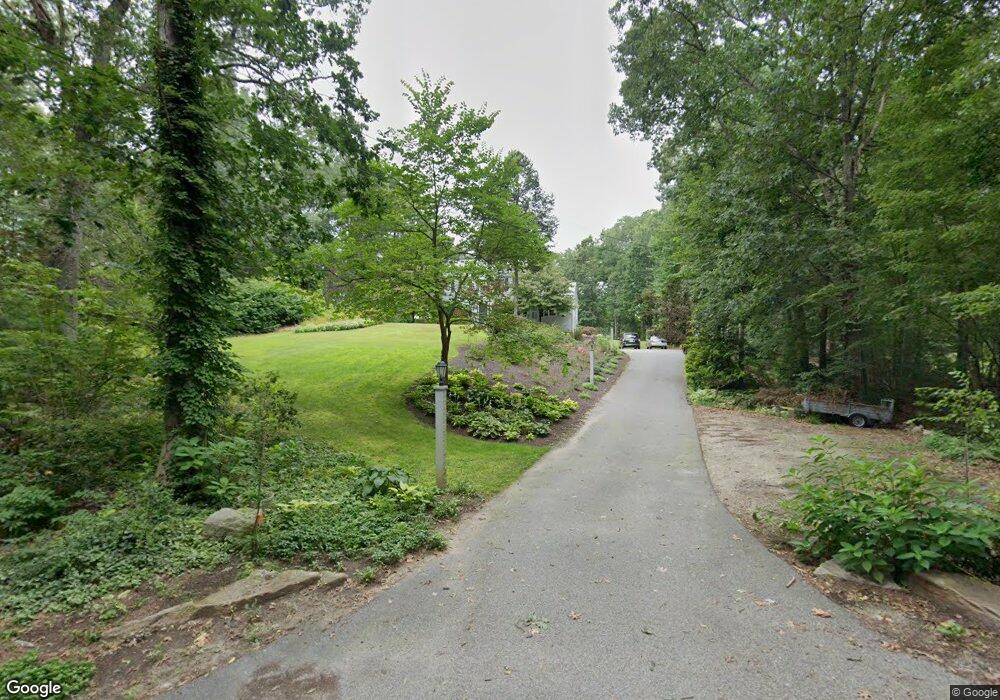
179 Hazel St Uxbridge, MA 01569
Estimated Value: $648,000 - $811,000
3
Beds
3
Baths
2,116
Sq Ft
$333/Sq Ft
Est. Value
About This Home
This home is located at 179 Hazel St, Uxbridge, MA 01569 and is currently estimated at $705,039, approximately $333 per square foot. 179 Hazel St is a home located in Worcester County with nearby schools including Uxbridge High School, Our Lady of the Valley Regional School, and Whitinsville Christian School.
Ownership History
Date
Name
Owned For
Owner Type
Purchase Details
Closed on
Feb 21, 2001
Sold by
Ja Taylor Constr
Bought by
Russell Neil P and Champagne Lisa A
Current Estimated Value
Home Financials for this Owner
Home Financials are based on the most recent Mortgage that was taken out on this home.
Original Mortgage
$265,500
Interest Rate
6.89%
Mortgage Type
Purchase Money Mortgage
Create a Home Valuation Report for This Property
The Home Valuation Report is an in-depth analysis detailing your home's value as well as a comparison with similar homes in the area
Home Values in the Area
Average Home Value in this Area
Purchase History
| Date | Buyer | Sale Price | Title Company |
|---|---|---|---|
| Russell Neil P | $295,000 | -- | |
| Ja Taylor Constr | $60,000 | -- |
Source: Public Records
Mortgage History
| Date | Status | Borrower | Loan Amount |
|---|---|---|---|
| Open | Ja Taylor Constr | $260,000 | |
| Closed | Ja Taylor Constr | $265,500 |
Source: Public Records
Tax History Compared to Growth
Tax History
| Year | Tax Paid | Tax Assessment Tax Assessment Total Assessment is a certain percentage of the fair market value that is determined by local assessors to be the total taxable value of land and additions on the property. | Land | Improvement |
|---|---|---|---|---|
| 2025 | $7,503 | $572,300 | $150,100 | $422,200 |
| 2024 | $7,066 | $546,900 | $138,400 | $408,500 |
| 2023 | $6,801 | $487,500 | $124,800 | $362,700 |
| 2022 | $6,244 | $411,900 | $113,800 | $298,100 |
| 2021 | $6,442 | $407,200 | $109,100 | $298,100 |
| 2020 | $6,370 | $380,500 | $113,100 | $267,400 |
| 2019 | $6,178 | $356,100 | $105,200 | $250,900 |
| 2018 | $5,972 | $347,800 | $105,200 | $242,600 |
| 2017 | $5,242 | $309,100 | $99,600 | $209,500 |
| 2016 | $5,573 | $317,200 | $102,200 | $215,000 |
| 2015 | $5,443 | $312,800 | $102,200 | $210,600 |
Source: Public Records
Map
Nearby Homes
- 60 Tyler Dr
- 7 Jefferson Ct Unit 7
- Layla Plan at Pine Ridge
- Ashley Plan at Pine Ridge
- Lily Plan at Pine Ridge
- Brooklyn Plan at Pine Ridge
- Tucker Plan at Pine Ridge
- Everleigh Plan at Pine Ridge
- 128 Mantell Rd
- 36 Elm St
- 100 Spring Hill Dr Unit 100
- 48 Homeward Ave
- 113 Rogerson Crossing Unit 113
- 307 N Main St
- 72 Homeward Ave
- 288 High St
- 129 Elm St Unit Lot 7
- 0 Homestead Ave
- 395 High St
- 33 Summerfield Dr Unit 33