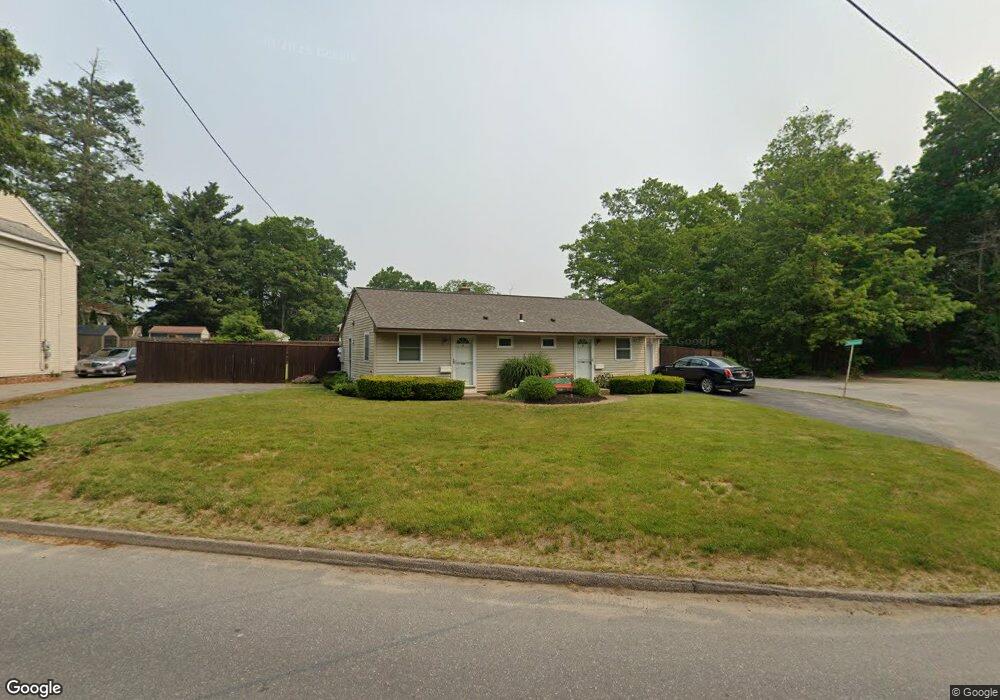
179 Sunderland Rd Worcester, MA 01604
Grafton Hill NeighborhoodEstimated Value: $356,000 - $463,000
3
Beds
2
Baths
1,299
Sq Ft
$308/Sq Ft
Est. Value
About This Home
This home is located at 179 Sunderland Rd, Worcester, MA 01604 and is currently estimated at $399,794, approximately $307 per square foot. 179 Sunderland Rd is a home located in Worcester County with nearby schools including Roosevelt Elementary School, Jacob Hiatt Magnet School, and Chandler Magnet.
Ownership History
Date
Name
Owned For
Owner Type
Purchase Details
Closed on
Jul 23, 1999
Sold by
Bagdon Edmund P
Bought by
Fegreus John C and Fegreus Therese M
Current Estimated Value
Home Financials for this Owner
Home Financials are based on the most recent Mortgage that was taken out on this home.
Original Mortgage
$80,000
Interest Rate
7.49%
Mortgage Type
Purchase Money Mortgage
Create a Home Valuation Report for This Property
The Home Valuation Report is an in-depth analysis detailing your home's value as well as a comparison with similar homes in the area
Home Values in the Area
Average Home Value in this Area
Purchase History
| Date | Buyer | Sale Price | Title Company |
|---|---|---|---|
| Fegreus John C | $90,000 | -- |
Source: Public Records
Mortgage History
| Date | Status | Borrower | Loan Amount |
|---|---|---|---|
| Open | Fegreus John C | $100,000 | |
| Closed | Fegreus John C | $80,000 |
Source: Public Records
Tax History
| Year | Tax Paid | Tax Assessment Tax Assessment Total Assessment is a certain percentage of the fair market value that is determined by local assessors to be the total taxable value of land and additions on the property. | Land | Improvement |
|---|---|---|---|---|
| 2025 | $4,897 | $371,300 | $118,800 | $252,500 |
| 2024 | $4,802 | $349,200 | $118,800 | $230,400 |
| 2023 | $4,362 | $304,200 | $103,300 | $200,900 |
| 2022 | $4,312 | $283,500 | $82,600 | $200,900 |
| 2021 | $3,653 | $224,400 | $66,100 | $158,300 |
| 2020 | $3,329 | $195,800 | $66,100 | $129,700 |
| 2019 | $3,301 | $183,400 | $59,500 | $123,900 |
| 2018 | $3,404 | $180,000 | $59,500 | $120,500 |
| 2017 | $3,425 | $178,200 | $59,500 | $118,700 |
| 2016 | $3,246 | $157,500 | $43,800 | $113,700 |
| 2015 | $3,161 | $157,500 | $43,800 | $113,700 |
| 2014 | $3,078 | $157,500 | $43,800 | $113,700 |
Source: Public Records
Map
Nearby Homes
- 143 Commonwealth Ave
- 25 Stoneham Rd
- 330 Sunderland Rd Unit 80
- 330 Sunderland Rd Unit 69
- 259 Massasoit Rd
- 340 Sunderland Rd Unit 28
- 256 Massasoit Rd
- 266 Massasoit Rd
- 62 Allston Ave
- 16 Vincent Cir
- 20 Brightwood Ave
- 83 Massasoit Rd
- 143 Dorcester
- 41 Modoc St
- Lot B Crawford St
- 9 Marissa Cir
- 19 Middlesex Ave
- 7 Atlas St
- 360 Hamilton St
- 3 Julien Ave
- 88 Progressive St
- 177 Sunderland Rd Unit B
- 177 Sunderland Rd Unit A
- 177a Sunderland Rd
- 181 Sunderland Rd
- 181 Sunderland Rd Unit 1
- 181 Sunderland Rd Unit 2
- 181 Sunderland Rd
- 122 Sunderland Rd
- 82 Progressive St
- 41 County St
- 120 Sunderland Rd
- 79 Progressive St
- 80 Progressive St
- 118 Sunderland Rd
- 183 Sunderland Rd
- 37 County St
- 77 Progressive St
- 151 Sunderland Rd
- 116 Sunderland Rd
Your Personal Tour Guide
Ask me questions while you tour the home.