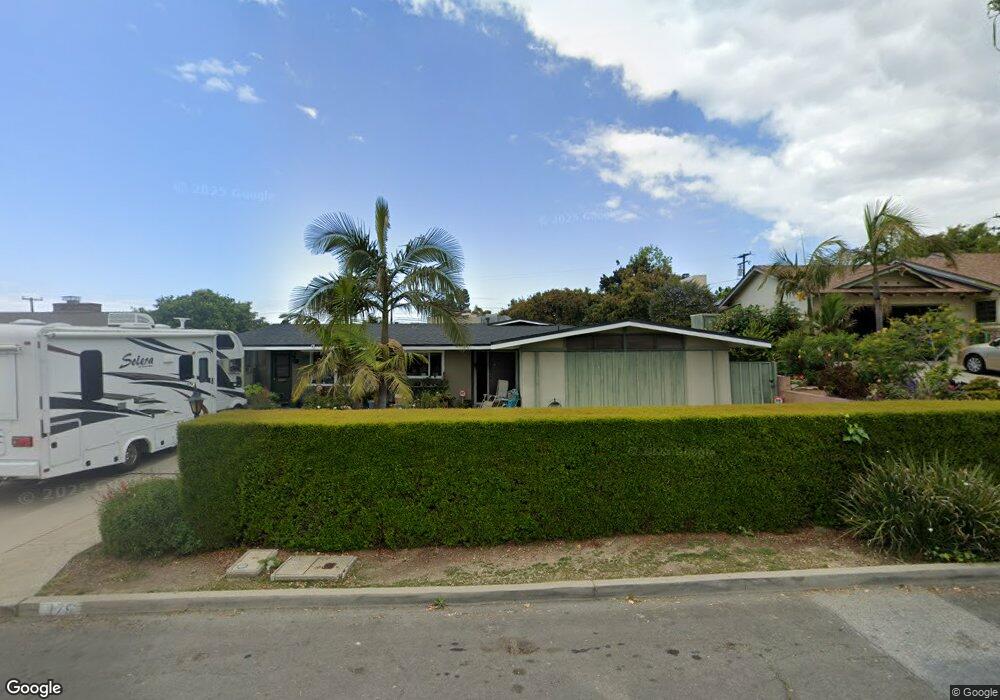
179 Teloma Dr Ventura, CA 93003
College NeighborhoodEstimated Value: $1,166,000 - $1,437,201
5
Beds
3
Baths
2,596
Sq Ft
$500/Sq Ft
Est. Value
About This Home
This home is located at 179 Teloma Dr, Ventura, CA 93003 and is currently estimated at $1,298,300, approximately $500 per square foot. 179 Teloma Dr is a home located in Ventura County with nearby schools including Poinsettia Elementary School, Anacapa Middle School, and Buena High School.
Ownership History
Date
Name
Owned For
Owner Type
Purchase Details
Closed on
Jun 21, 2024
Sold by
Poehler Arnold and Poehler Glenda L
Bought by
Poehler Family Revocable Trust and Poehler
Current Estimated Value
Purchase Details
Closed on
Jun 15, 2009
Sold by
Virnig Joseph A
Bought by
Poehler Arnold and Poehler Glenda L
Home Financials for this Owner
Home Financials are based on the most recent Mortgage that was taken out on this home.
Original Mortgage
$417,000
Interest Rate
4.83%
Mortgage Type
Purchase Money Mortgage
Purchase Details
Closed on
Jul 10, 2007
Sold by
Macleod Joyce D
Bought by
Virnig Joseph A
Home Financials for this Owner
Home Financials are based on the most recent Mortgage that was taken out on this home.
Original Mortgage
$495,000
Interest Rate
6.62%
Mortgage Type
Purchase Money Mortgage
Purchase Details
Closed on
Mar 24, 1995
Sold by
Macleod Kenneth G
Bought by
Macleod Kenneth G
Create a Home Valuation Report for This Property
The Home Valuation Report is an in-depth analysis detailing your home's value as well as a comparison with similar homes in the area
Home Values in the Area
Average Home Value in this Area
Purchase History
| Date | Buyer | Sale Price | Title Company |
|---|---|---|---|
| Poehler Family Revocable Trust | -- | None Listed On Document | |
| Poehler Arnold | $589,000 | Fidelity National Title Co | |
| Virnig Joseph A | $740,000 | Old Republic Title Company | |
| Macleod Kenneth G | -- | -- |
Source: Public Records
Mortgage History
| Date | Status | Borrower | Loan Amount |
|---|---|---|---|
| Previous Owner | Poehler Arnold | $417,000 | |
| Previous Owner | Virnig Joseph A | $495,000 |
Source: Public Records
Tax History Compared to Growth
Tax History
| Year | Tax Paid | Tax Assessment Tax Assessment Total Assessment is a certain percentage of the fair market value that is determined by local assessors to be the total taxable value of land and additions on the property. | Land | Improvement |
|---|---|---|---|---|
| 2025 | $8,061 | $758,475 | $515,098 | $243,377 |
| 2024 | $8,061 | $743,603 | $504,998 | $238,605 |
| 2023 | $7,969 | $729,023 | $495,096 | $233,927 |
| 2022 | $7,402 | $714,729 | $485,388 | $229,341 |
| 2021 | $7,273 | $700,715 | $475,870 | $224,845 |
| 2020 | $7,206 | $693,533 | $470,992 | $222,541 |
| 2019 | $7,073 | $679,935 | $461,757 | $218,178 |
| 2018 | $6,952 | $666,603 | $452,703 | $213,900 |
| 2017 | $6,823 | $653,533 | $443,827 | $209,706 |
| 2016 | $6,702 | $640,720 | $435,125 | $205,595 |
| 2015 | $6,593 | $631,097 | $428,590 | $202,507 |
| 2014 | $6,498 | $618,737 | $420,196 | $198,541 |
Source: Public Records
Map
Nearby Homes
- 275 Fairfax Ave
- 288 Byron Ave
- 262 Crestwood Ave
- 412 Dayloma Ave
- 4797 Loma Vista Rd
- 5633 Pembroke St
- 201 Xavier Ave
- 5535 Larkin St
- 572 Skyline Rd
- 5365 Queens St
- 5438 Rainier St
- 6005 Sutter St
- 322 S Victoria Ave
- 6019 Cloverly St
- 159 Donner Ave
- 6174 Cobblestone Dr
- 6153 Cobblestone Dr
- 146 Donner Ave
- 91 Mount Whitney Ct
- 4700 Aurora Dr Unit 16