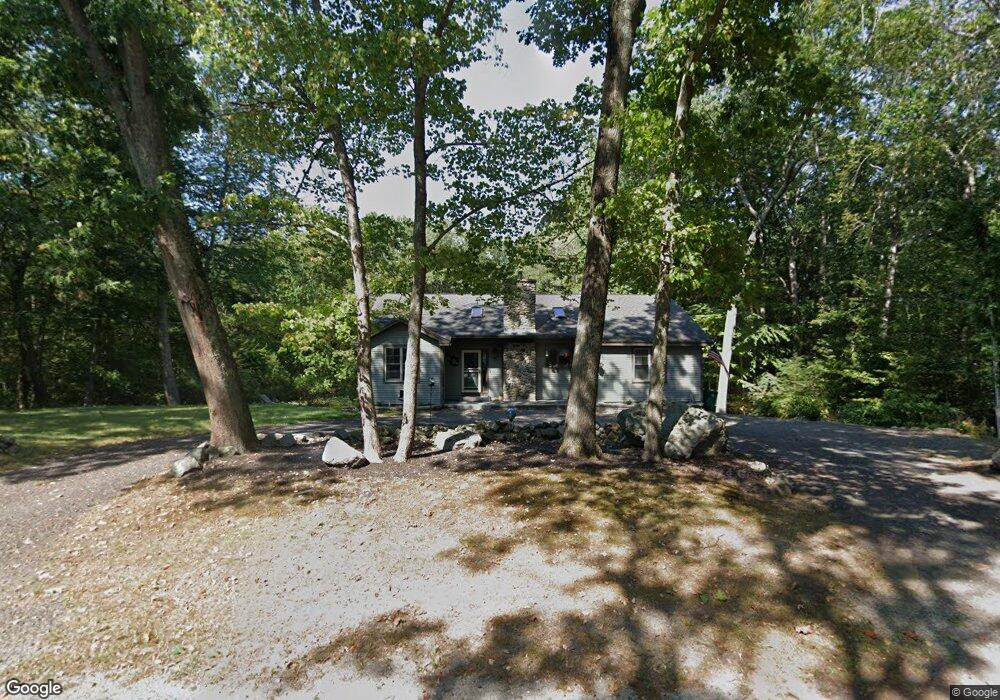
179 Woodland Rd Hampton, NH 03842
Estimated Value: $712,000 - $753,000
3
Beds
2
Baths
2,188
Sq Ft
$338/Sq Ft
Est. Value
About This Home
This home is located at 179 Woodland Rd, Hampton, NH 03842 and is currently estimated at $739,681, approximately $338 per square foot. 179 Woodland Rd is a home located in Rockingham County with nearby schools including Hampton Centre School, Adeline C. Marston Elementary School, and Hampton Academy.
Ownership History
Date
Name
Owned For
Owner Type
Purchase Details
Closed on
Nov 23, 2021
Sold by
Mcgrail Scott
Bought by
Mcgrail Scott and Mcgrail Danielle L
Current Estimated Value
Home Financials for this Owner
Home Financials are based on the most recent Mortgage that was taken out on this home.
Original Mortgage
$360,000
Outstanding Balance
$330,152
Interest Rate
3.05%
Mortgage Type
Stand Alone Refi Refinance Of Original Loan
Estimated Equity
$409,529
Purchase Details
Closed on
Dec 20, 2019
Sold by
Bowen William V and Bowen Alice D
Bought by
Mcgrail Scott
Home Financials for this Owner
Home Financials are based on the most recent Mortgage that was taken out on this home.
Original Mortgage
$343,406
Interest Rate
3.25%
Mortgage Type
FHA
Purchase Details
Closed on
Jun 2, 1994
Bought by
Bowen William and Bowen Alice D
Create a Home Valuation Report for This Property
The Home Valuation Report is an in-depth analysis detailing your home's value as well as a comparison with similar homes in the area
Home Values in the Area
Average Home Value in this Area
Purchase History
| Date | Buyer | Sale Price | Title Company |
|---|---|---|---|
| Mcgrail Scott | -- | None Available | |
| Mcgrail Scott | -- | None Available | |
| Mcgrail Scott | $375,000 | None Available | |
| Bowen William | $140,000 | -- |
Source: Public Records
Mortgage History
| Date | Status | Borrower | Loan Amount |
|---|---|---|---|
| Open | Mcgrail Scott | $360,000 | |
| Closed | Mcgrail Scott | $360,000 | |
| Previous Owner | Mcgrail Scott | $343,406 | |
| Previous Owner | Bowen William | $25,000 | |
| Previous Owner | Bowen William | $240,000 |
Source: Public Records
Tax History Compared to Growth
Tax History
| Year | Tax Paid | Tax Assessment Tax Assessment Total Assessment is a certain percentage of the fair market value that is determined by local assessors to be the total taxable value of land and additions on the property. | Land | Improvement |
|---|---|---|---|---|
| 2024 | $6,998 | $568,000 | $292,800 | $275,200 |
| 2023 | $6,774 | $404,400 | $195,100 | $209,300 |
| 2022 | $6,406 | $404,400 | $195,100 | $209,300 |
| 2021 | $6,406 | $404,400 | $195,100 | $209,300 |
| 2020 | $6,087 | $382,100 | $195,100 | $187,000 |
| 2019 | $6,117 | $382,100 | $195,100 | $187,000 |
| 2018 | $6,947 | $339,300 | $177,500 | $161,800 |
| 2017 | $6,762 | $339,300 | $177,500 | $161,800 |
| 2016 | $6,628 | $339,300 | $177,500 | $161,800 |
Source: Public Records
Map
Nearby Homes
- 159 Woodland Rd
- 19 Katie Ln
- 19 Juniper Ln
- 23 Rockrimmon Rd
- 7 Hunter Dr
- 16 Briar Rd
- 467 High St Unit 22
- 403 High St
- 81 Little River Rd
- 190 Kings Hwy Unit A1
- 947 Ocean Blvd Unit 10
- 7 Greene St
- 182 Kings Hwy
- 3 Greene St
- 338 High St
- 917 Ocean Blvd
- 92 Dunvegan Woods
- 38 Dunvegan Woods
- 330 High St
- 30 Ancient Hwy