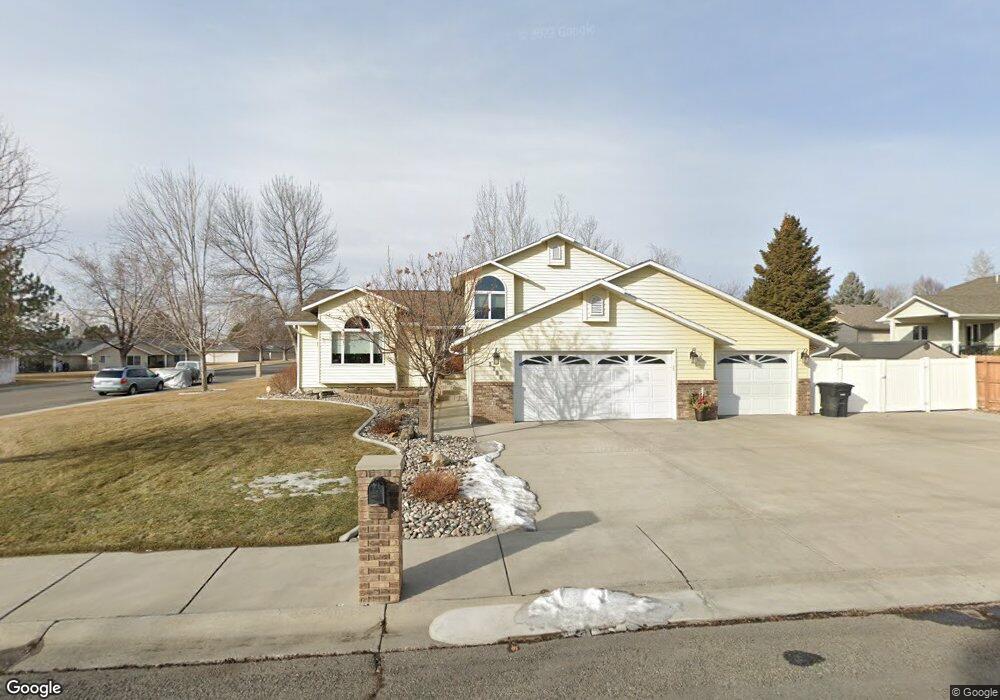
1790 Judd Cir Billings, MT 59102
North Central Billings NeighborhoodEstimated Value: $341,000 - $585,000
3
Beds
4
Baths
2,205
Sq Ft
$220/Sq Ft
Est. Value
About This Home
This home is located at 1790 Judd Cir, Billings, MT 59102 and is currently estimated at $484,172, approximately $219 per square foot. 1790 Judd Cir is a home located in Yellowstone County with nearby schools including Boulder School, Will James Junior High School, and Billings Senior High School.
Ownership History
Date
Name
Owned For
Owner Type
Purchase Details
Closed on
Jan 31, 2011
Sold by
Willford Kari L and Willford Troy G
Bought by
Hagel Douglas and Hagel Katherine A
Current Estimated Value
Home Financials for this Owner
Home Financials are based on the most recent Mortgage that was taken out on this home.
Original Mortgage
$208,000
Outstanding Balance
$8,030
Interest Rate
4.82%
Mortgage Type
New Conventional
Estimated Equity
$476,142
Purchase Details
Closed on
Aug 3, 2007
Sold by
Steele Terry L and Steele Kelly R
Bought by
Willford Troy G and Willford Kari L
Home Financials for this Owner
Home Financials are based on the most recent Mortgage that was taken out on this home.
Original Mortgage
$223,200
Interest Rate
6.66%
Mortgage Type
Purchase Money Mortgage
Create a Home Valuation Report for This Property
The Home Valuation Report is an in-depth analysis detailing your home's value as well as a comparison with similar homes in the area
Home Values in the Area
Average Home Value in this Area
Purchase History
| Date | Buyer | Sale Price | Title Company |
|---|---|---|---|
| Hagel Douglas | -- | None Available | |
| Willford Troy G | -- | None Available |
Source: Public Records
Mortgage History
| Date | Status | Borrower | Loan Amount |
|---|---|---|---|
| Open | Hagel Douglas | $208,000 | |
| Previous Owner | Willford Troy G | $223,200 |
Source: Public Records
Tax History Compared to Growth
Tax History
| Year | Tax Paid | Tax Assessment Tax Assessment Total Assessment is a certain percentage of the fair market value that is determined by local assessors to be the total taxable value of land and additions on the property. | Land | Improvement |
|---|---|---|---|---|
| 2025 | $4,802 | $545,900 | $98,633 | $447,267 |
| 2024 | $4,802 | $506,800 | $91,426 | $415,374 |
| 2023 | $4,790 | $506,800 | $91,426 | $415,374 |
| 2022 | $3,285 | $347,900 | $0 | $0 |
| 2021 | $3,595 | $347,900 | $0 | $0 |
| 2020 | $3,603 | $334,300 | $0 | $0 |
| 2019 | $3,436 | $334,300 | $0 | $0 |
| 2018 | $3,344 | $319,200 | $0 | $0 |
| 2017 | $2,955 | $319,200 | $0 | $0 |
| 2016 | $3,095 | $307,600 | $0 | $0 |
| 2015 | $2,869 | $290,500 | $0 | $0 |
| 2014 | $2,630 | $141,457 | $0 | $0 |
Source: Public Records
Map
Nearby Homes
- 0 Julianne Dr Unit 354976
- 0 Julianne Dr Unit 354975
- 1716 Patricia Ln
- 1820 Patricia Ln
- 1824 Patricia Ln
- 1815 28th St W
- 3078 Colton Blvd
- 3202 Avenue F
- 2820 Boulder Ave
- 2903 Belvedere Dr
- 1605 Forest Park Dr
- 2641 Forest Meadow Ln
- 2624 Southridge Dr
- 1125 30th St W
- 2550 Forest Meadow Ln
- 5915 Southridge Dr
- 3107 Poly Dr
- 2060 Edgewood Dr
- 2516 Lyndale Ln
- 2900 Manhattan Dr