Estimated Value: $913,000 - $1,572,433
4
Beds
1
Bath
2,444
Sq Ft
$470/Sq Ft
Est. Value
About This Home
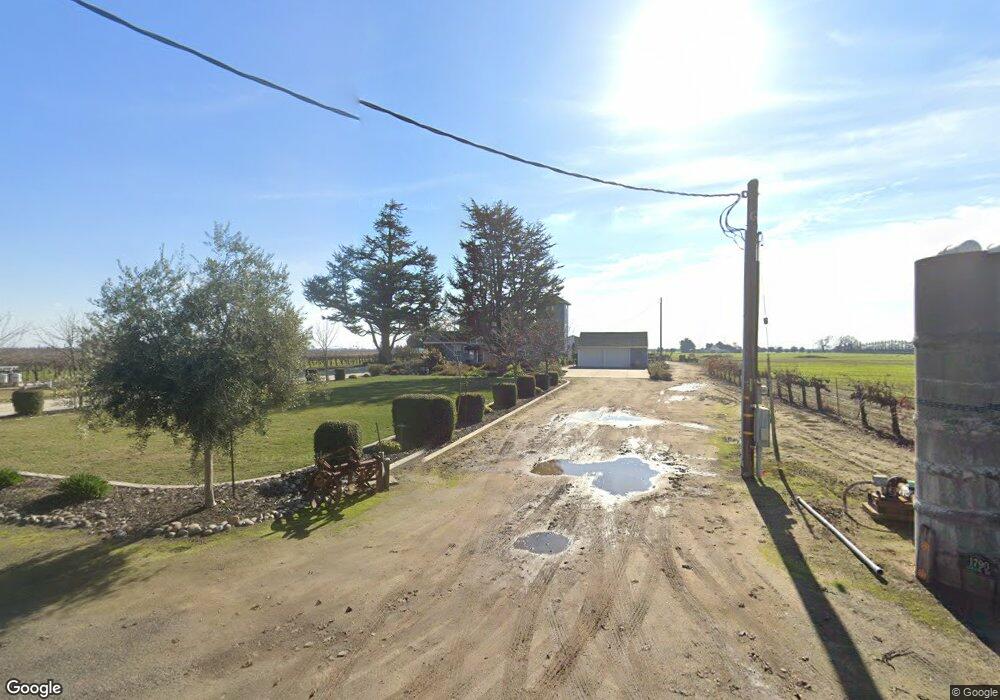
This home is located at 1790 Larson Rd, Lodi, CA 95242 and is currently estimated at $1,148,478, approximately $469 per square foot. 1790 Larson Rd is a home located in San Joaquin County with nearby schools including Ellerth E. Larson Elementary School, Lodi Middle School, and Tokay High School.
Ownership History
Date
Name
Owned For
Owner Type
Purchase Details
Closed on
Sep 11, 2024
Sold by
Moore Family 1989 Trust and Moore Marilyn R
Bought by
Wendy G Moore And Kathy L Nylen Revocable Tru and Moore
Current Estimated Value
Purchase Details
Closed on
Jun 11, 2014
Sold by
Moore Wendy G
Bought by
Wendy G Moore & Kathy L Nylen Revocable
Purchase Details
Closed on
Jul 3, 2012
Sold by
Moore Marilyn R
Bought by
Moore Marilyn R
Purchase Details
Closed on
Dec 29, 2010
Sold by
Moore Wendy G
Bought by
Moore Wendy G
Purchase Details
Closed on
Sep 14, 2010
Sold by
Moore Wendy G
Bought by
Moore Wendy G
Purchase Details
Closed on
Feb 11, 2010
Sold by
Moore Wendy G
Bought by
Moore Wendy G
Purchase Details
Closed on
Aug 14, 2006
Sold by
Moore Mildred I
Bought by
Moore Mildred I
Create a Home Valuation Report for This Property
The Home Valuation Report is an in-depth analysis detailing your home's value as well as a comparison with similar homes in the area
Purchase History
| Date | Buyer | Sale Price | Title Company |
|---|---|---|---|
| Wendy G Moore And Kathy L Nylen Revocable Tru | $220,000 | Old Republic Title | |
| Wendy G Moore & Kathy L Nylen Revocable | -- | None Available | |
| Moore Marilyn R | -- | None Available | |
| Moore Wendy G | -- | None Available | |
| Moore Wendy G | -- | None Available | |
| Moore Wendy G | -- | None Available | |
| Moore Mildred I | -- | None Available |
Source: Public Records
Tax History
| Year | Tax Paid | Tax Assessment Tax Assessment Total Assessment is a certain percentage of the fair market value that is determined by local assessors to be the total taxable value of land and additions on the property. | Land | Improvement |
|---|---|---|---|---|
| 2025 | $8,119 | $714,042 | $285,998 | $428,044 |
| 2024 | $13,291 | $1,196,389 | $653,185 | $543,204 |
| 2023 | $13,090 | $1,168,047 | $640,378 | $445,119 |
| 2022 | $12,818 | $1,145,945 | $627,822 | $518,123 |
| 2021 | $13,094 | $1,128,088 | $615,512 | $512,576 |
| 2020 | $12,455 | $1,123,889 | $609,201 | $514,688 |
| 2019 | $12,299 | $1,110,492 | $597,256 | $513,236 |
| 2018 | $12,121 | $1,088,162 | $585,546 | $502,616 |
| 2017 | $11,975 | $1,078,104 | $574,065 | $504,039 |
| 2016 | $10,822 | $1,018,609 | $562,812 | $455,797 |
| 2015 | $10,400 | $974,316 | $537,124 | $437,192 |
| 2014 | $10,296 | $961,190 | $526,607 | $434,583 |
Source: Public Records
Map
Nearby Homes
- 23181 Devries Rd
- 21610 Devries Rd
- 1647 Marigold Way
- 209 E Highway 12
- 291 E Highway 12
- 931 W Sargent Rd
- 2933 Coronado Dr
- 4175 W Sargent Rd
- 2826 Cameo St
- 2926 La Jolla Way
- 3040 Carrousel St
- 2921 Coronado Dr
- 1501 Empire Dr
- 2830 Mcintosh Dr
- 1820 Van Ruiten Dr
- 3053 Valencia St
- 1560 Empire Dr
- 3087 Wisteria Dr
- 2905 Zinnia Way
- 2912 Zinnia Way
- 15279 N Davis Rd
- 1311 W Highway 12
- 21759 N Davis Rd
- 23371 N Davis Rd
- 15521 N Davis Rd
- 1617 Larson Rd
- 1851 W Highway 12
- 15625 N Davis Rd
- 1675 Larson Rd
- 15662 N Davis Rd
- 1844 W Highway 12
- 15271 Moore Rd
- 14770 N Davis Rd
- 1995 Larson Rd
- 1990 W Highway 12
- 15799 N Davis Rd
- 1230 W Highway 12
- 15441 Moore Rd
- 15595 Moore Rd
- 2201 W Highway 12
Your Personal Tour Guide
Ask me questions while you tour the home.