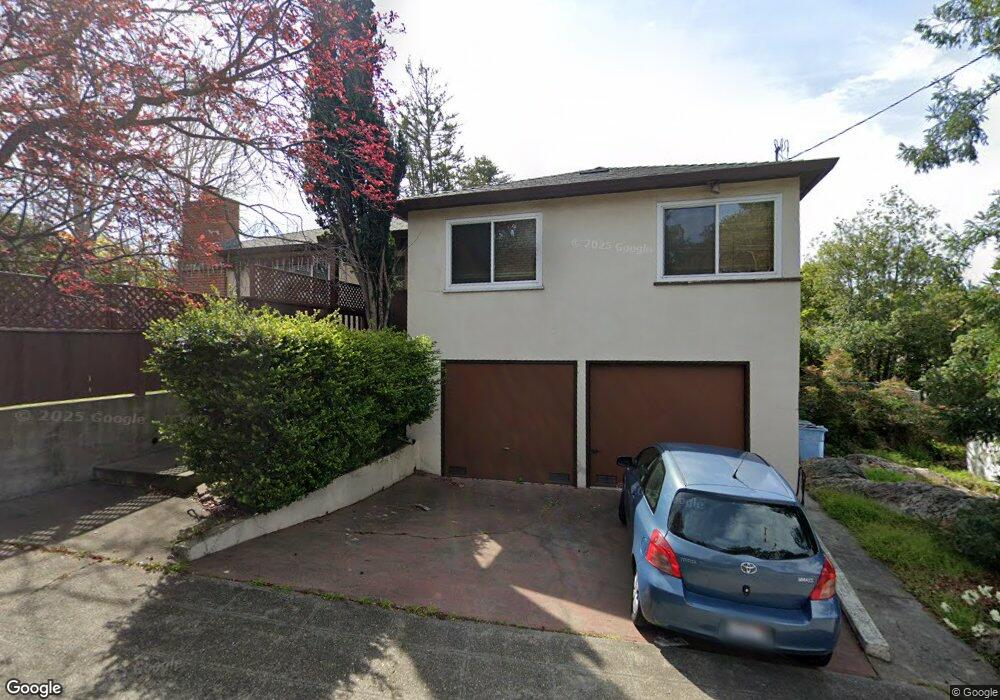
1790 Thousand Oaks Blvd Berkeley, CA 94707
Thousand Oaks NeighborhoodEstimated Value: $1,388,931 - $1,844,000
3
Beds
2
Baths
1,448
Sq Ft
$1,138/Sq Ft
Est. Value
About This Home
This home is located at 1790 Thousand Oaks Blvd, Berkeley, CA 94707 and is currently estimated at $1,647,483, approximately $1,137 per square foot. 1790 Thousand Oaks Blvd is a home located in Alameda County with nearby schools including Thousand Oaks Elementary School, Ruth Acty Elementary, and Berkeley Arts Magnet at Whittier School.
Ownership History
Date
Name
Owned For
Owner Type
Purchase Details
Closed on
Jun 24, 2020
Sold by
Taylor Judy
Bought by
Taylor Judy Anne and The Judy Anne Taylor Living Tr
Current Estimated Value
Purchase Details
Closed on
Jan 12, 1996
Sold by
Vujic Jasmina
Bought by
Vujic Jasmina and Vujic Nenad D
Home Financials for this Owner
Home Financials are based on the most recent Mortgage that was taken out on this home.
Original Mortgage
$200,000
Interest Rate
7.36%
Purchase Details
Closed on
Dec 27, 1995
Sold by
Vujic Nenad D
Bought by
Vujic Jasmina
Home Financials for this Owner
Home Financials are based on the most recent Mortgage that was taken out on this home.
Original Mortgage
$200,000
Interest Rate
7.36%
Purchase Details
Closed on
Dec 26, 1995
Sold by
Cossen Richard L and Cossen Cynthia K
Bought by
Vujic Jasmina
Home Financials for this Owner
Home Financials are based on the most recent Mortgage that was taken out on this home.
Original Mortgage
$200,000
Interest Rate
7.36%
Create a Home Valuation Report for This Property
The Home Valuation Report is an in-depth analysis detailing your home's value as well as a comparison with similar homes in the area
Home Values in the Area
Average Home Value in this Area
Purchase History
| Date | Buyer | Sale Price | Title Company |
|---|---|---|---|
| Taylor Judy Anne | -- | Chicago Title Company | |
| Vujic Jasmina | -- | -- | |
| Vujic Jasmina | -- | First American Title Guarant | |
| Vujic Jasmina | $275,000 | First American Title Guarant |
Source: Public Records
Mortgage History
| Date | Status | Borrower | Loan Amount |
|---|---|---|---|
| Previous Owner | Vujic Jasmina | $200,000 |
Source: Public Records
Tax History
| Year | Tax Paid | Tax Assessment Tax Assessment Total Assessment is a certain percentage of the fair market value that is determined by local assessors to be the total taxable value of land and additions on the property. | Land | Improvement |
|---|---|---|---|---|
| 2025 | $10,079 | $449,818 | $137,045 | $319,773 |
| 2024 | $10,079 | $440,861 | $134,358 | $313,503 |
| 2023 | $9,743 | $439,081 | $131,724 | $307,357 |
| 2022 | $9,627 | $423,473 | $129,142 | $301,331 |
| 2021 | $9,621 | $415,033 | $126,610 | $295,423 |
| 2020 | $9,102 | $417,707 | $125,312 | $292,395 |
| 2019 | $8,709 | $409,518 | $122,855 | $286,663 |
| 2018 | $8,507 | $401,491 | $120,447 | $281,044 |
| 2017 | $8,196 | $393,620 | $118,086 | $275,534 |
| 2016 | $7,868 | $385,904 | $115,771 | $270,133 |
| 2015 | $7,731 | $380,110 | $114,033 | $266,077 |
| 2014 | $7,621 | $372,665 | $111,799 | $260,866 |
Source: Public Records
Map
Nearby Homes
- 1563 Thousand Oaks Blvd
- 1983 Yosemite Rd
- 589 San Luis Rd
- 483 Boynton Ave
- 770 Santa Barbara Rd
- 720 Key Route Blvd
- 385 Vermont Ave
- 1259 Portland Ave
- 1266 Washington Ave
- 225 Arlington Ave
- 820 Key Route Blvd
- 826 Indian Rock Ave
- 479 Kentucky Ave
- 840 Key Route Blvd
- 606 Masonic Ave
- 255 Stanford Ave
- 614 Cragmont Ave
- 201 Amherst Ave
- 417 Evelyn Ave Unit 205
- 7316 Rockway Ave
- 606 The Alameda
- 1770 Thousand Oaks Blvd
- 1797 Thousand Oaks Blvd
- 612 The Alameda
- 603 Santa Rosa Ave
- 1771 Thousand Oaks Blvd
- 1801 Yosemite Rd
- 1800 Thousand Oaks Blvd
- 609 Santa Rosa Ave
- 616 The Alameda
- 1811 Yosemite Rd
- 585 Santa Rosa Ave
- 597 The Alameda
- 617 Santa Rosa Ave
- 588 The Alameda
- 620 The Alameda
- 1817 Yosemite Rd
- 1818 Thousand Oaks Blvd
- 1800 Yosemite Rd
- 604 Santa Rosa Ave
Your Personal Tour Guide
Ask me questions while you tour the home.