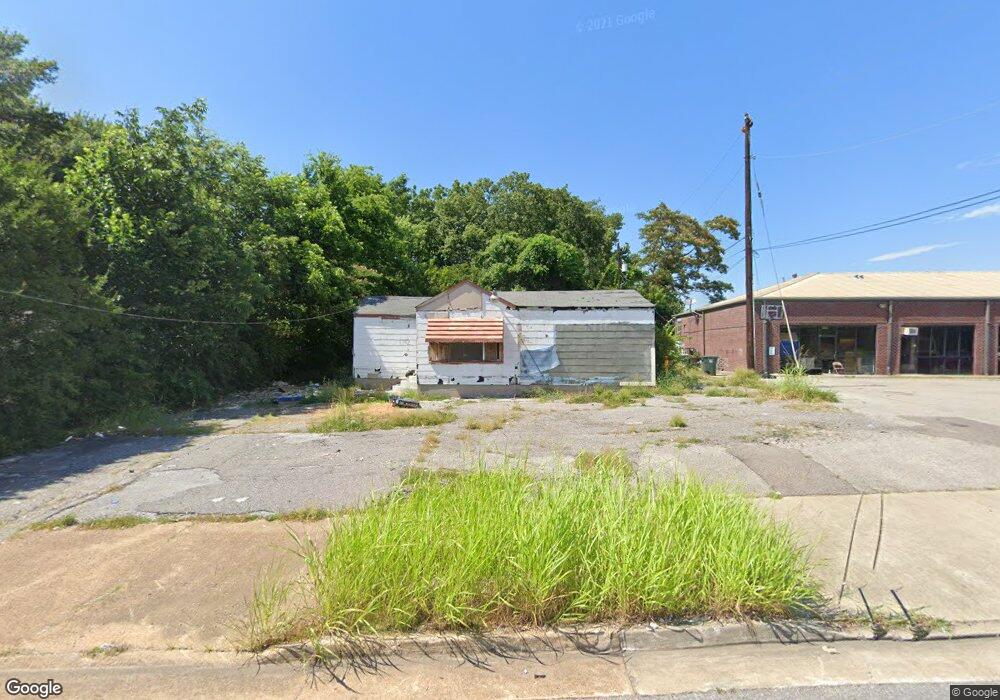
1792 Corning Ave Memphis, TN 38127
Frayser NeighborhoodEstimated Value: $124,578
--
Bed
--
Bath
1,016
Sq Ft
$123/Sq Ft
Est. Value
About This Home
This home is located at 1792 Corning Ave, Memphis, TN 38127 and is currently estimated at $124,578, approximately $122 per square foot. 1792 Corning Ave is a home located in Shelby County with nearby schools including Georgian Hills Middle School, Trezevant High School, and Cornerstone Prep Denver Campus.
Ownership History
Date
Name
Owned For
Owner Type
Purchase Details
Closed on
Mar 20, 2018
Sold by
Hatslett Lawrence
Bought by
Malone Leslie
Current Estimated Value
Purchase Details
Closed on
Jan 17, 2018
Sold by
Williams Theodore
Bought by
Hayslett Lawrence
Purchase Details
Closed on
Jul 27, 2016
Sold by
Goddy Gain Morio U
Bought by
William Theodore
Purchase Details
Closed on
Dec 30, 2014
Sold by
Williams Theodore
Bought by
4 Gain
Purchase Details
Closed on
Feb 28, 2014
Sold by
Williams Bryan X
Bought by
Williams Theodore
Purchase Details
Closed on
Sep 30, 2004
Sold by
Hobbs Shea
Bought by
Shotwell Teresa A
Purchase Details
Closed on
Oct 11, 2000
Sold by
Moore Charles E
Bought by
Shotwell Teresa A and Hobbs Shea
Purchase Details
Closed on
Jun 14, 2000
Sold by
Mastin Mary Ann King
Bought by
Moore Charles E
Home Financials for this Owner
Home Financials are based on the most recent Mortgage that was taken out on this home.
Original Mortgage
$35,000
Interest Rate
8%
Mortgage Type
Seller Take Back
Create a Home Valuation Report for This Property
The Home Valuation Report is an in-depth analysis detailing your home's value as well as a comparison with similar homes in the area
Home Values in the Area
Average Home Value in this Area
Purchase History
| Date | Buyer | Sale Price | Title Company |
|---|---|---|---|
| Malone Leslie | -- | None Available | |
| Hayslett Lawrence | -- | None Available | |
| William Theodore | -- | None Available | |
| 4 Gain | -- | None Available | |
| Williams Theodore | -- | None Available | |
| Shotwell Teresa A | -- | -- | |
| Shotwell Teresa A | $55,000 | -- | |
| Moore Charles E | $40,000 | -- |
Source: Public Records
Mortgage History
| Date | Status | Borrower | Loan Amount |
|---|---|---|---|
| Previous Owner | Moore Charles E | $35,000 |
Source: Public Records
Tax History Compared to Growth
Tax History
| Year | Tax Paid | Tax Assessment Tax Assessment Total Assessment is a certain percentage of the fair market value that is determined by local assessors to be the total taxable value of land and additions on the property. | Land | Improvement |
|---|---|---|---|---|
| 2025 | $151 | $5,560 | $5,000 | $560 |
| 2024 | $151 | $4,440 | $4,080 | $360 |
| 2023 | $270 | $4,440 | $4,080 | $360 |
| 2022 | $270 | $4,440 | $4,080 | $360 |
| 2021 | $321 | $4,440 | $4,080 | $360 |
| 2020 | $319 | $4,400 | $4,080 | $320 |
| 2019 | $141 | $4,400 | $4,080 | $320 |
| 2018 | $141 | $4,400 | $4,080 | $320 |
| 2017 | $144 | $4,400 | $4,080 | $320 |
| 2016 | $189 | $4,320 | $0 | $0 |
| 2014 | $189 | $4,320 | $0 | $0 |
Source: Public Records
Map
Nearby Homes
- 3618 N Watkins St
- 0 Old Benjestown Rd
- 3558 Kensett Dr
- 3603 Bigelow St
- 3766 Argonne St
- 1651 Corning Ave
- 1838 Townsend Ave
- 1753 Winston Dr
- 1947 Tulsa Ave
- 1820 Saint Elmo Ave
- 1834 Saint Elmo Ave
- 3580 Winston Dr
- 3794 Donna Dr
- 3536 Winston Dr
- 1612 Winston Dr
- 3585 Winston Dr
- 2044 Corning Ave
- 1670 Corning Ave
- 1930 Saint Elmo Ave
- 2011 Lauretta Ave
- 1786 Corning Ave
- 3672 Gillie St
- 3678 Gillie St
- 3631 N Watkins St
- 1770 Corning Ave
- 3684 Gillie St
- 3642 Gillie St
- 3675 N Watkins St
- 3677 Gillie St
- 1762 Corning Ave
- 1763 Cleoford Ave
- 3634 Gillie St
- 1756 Corning Ave
- 3694 Gillie St
- 1757 Cleoford Ave
- 3641 Gillie St
- 3624 Gillie St
- 1748 Corning Ave
- 3698 Gillie St
- 1762 Cleoford Ave