1793 N Main St Pittsburg, NH 03592
Estimated Value: $271,000 - $489,000
1
Bed
1
Bath
1,488
Sq Ft
$252/Sq Ft
Est. Value
About This Home
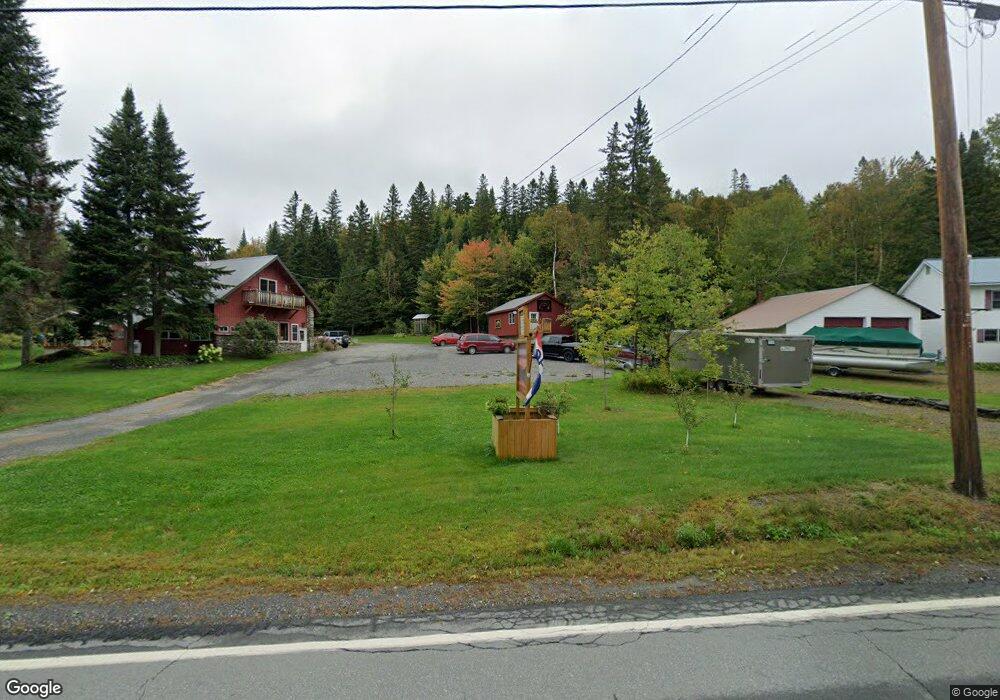
This home is located at 1793 N Main St, Pittsburg, NH 03592 and is currently estimated at $375,286, approximately $252 per square foot. 1793 N Main St is a home with nearby schools including Pittsburg Elementary/Middle School and Pittsburg High School.
Ownership History
Date
Name
Owned For
Owner Type
Purchase Details
Closed on
Sep 1, 2017
Sold by
Simpson Irt and Simpson Maurice E
Bought by
Lacasse Raymond F and Lacasse Sylvia M
Current Estimated Value
Home Financials for this Owner
Home Financials are based on the most recent Mortgage that was taken out on this home.
Original Mortgage
$144,000
Outstanding Balance
$120,444
Interest Rate
3.96%
Mortgage Type
Purchase Money Mortgage
Estimated Equity
$254,842
Purchase Details
Closed on
Apr 14, 2016
Sold by
Simpson Maurice E and Simpson Linda A
Bought by
Simpson Irt
Create a Home Valuation Report for This Property
The Home Valuation Report is an in-depth analysis detailing your home's value as well as a comparison with similar homes in the area
Home Values in the Area
Average Home Value in this Area
Purchase History
| Date | Buyer | Sale Price | Title Company |
|---|---|---|---|
| Lacasse Raymond F | $160,000 | -- | |
| Simpson Irt | -- | -- |
Source: Public Records
Mortgage History
| Date | Status | Borrower | Loan Amount |
|---|---|---|---|
| Open | Lacasse Raymond F | $144,000 |
Source: Public Records
Tax History Compared to Growth
Tax History
| Year | Tax Paid | Tax Assessment Tax Assessment Total Assessment is a certain percentage of the fair market value that is determined by local assessors to be the total taxable value of land and additions on the property. | Land | Improvement |
|---|---|---|---|---|
| 2024 | $3,444 | $358,700 | $136,500 | $222,200 |
| 2023 | $3,444 | $358,700 | $136,500 | $222,200 |
| 2022 | $3,045 | $191,500 | $35,400 | $156,100 |
| 2021 | $2,773 | $178,200 | $35,400 | $142,800 |
| 2020 | $2,652 | $168,400 | $33,700 | $134,700 |
| 2019 | $2,694 | $168,400 | $33,700 | $134,700 |
| 2018 | $2,556 | $168,400 | $33,700 | $134,700 |
| 2016 | $2,485 | $158,300 | $41,600 | $116,700 |
| 2015 | $2,580 | $158,300 | $41,600 | $116,700 |
| 2014 | $2,731 | $158,300 | $41,600 | $116,700 |
| 2013 | $2,644 | $158,300 | $41,600 | $116,700 |
Source: Public Records
Map
Nearby Homes