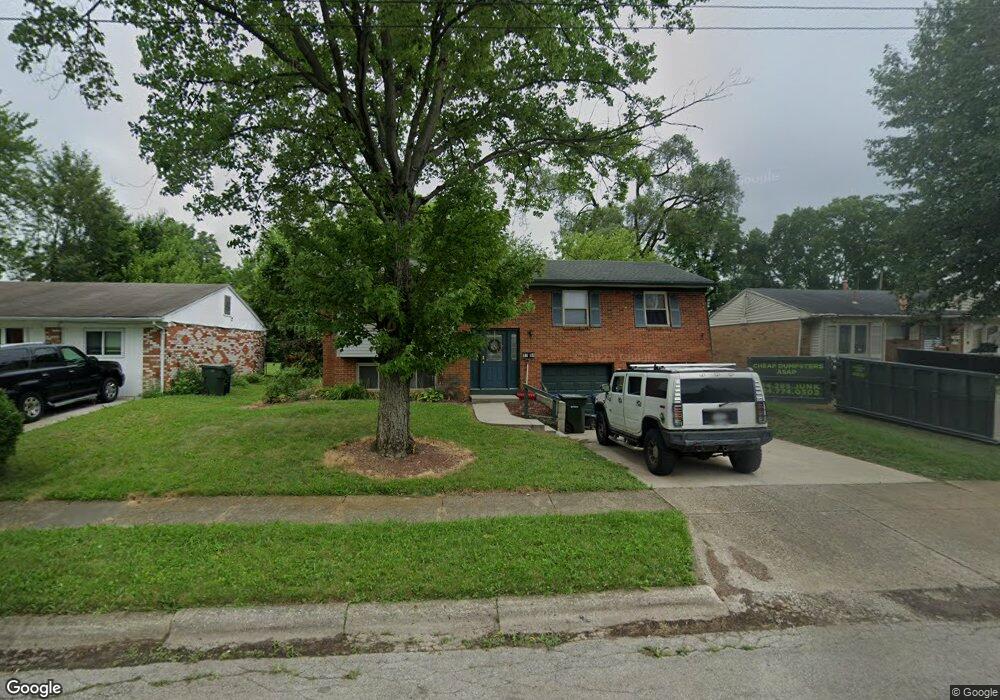
1794 Newfield Rd Columbus, OH 43209
Berwick NeighborhoodEstimated Value: $211,000 - $326,000
3
Beds
2
Baths
1,510
Sq Ft
$170/Sq Ft
Est. Value
About This Home
This home is located at 1794 Newfield Rd, Columbus, OH 43209 and is currently estimated at $256,812, approximately $170 per square foot. 1794 Newfield Rd is a home located in Franklin County with nearby schools including Berwick Alternative K-8 School, Walnut Ridge High School, and Whitehall Preparatory And Fitness Academy.
Ownership History
Date
Name
Owned For
Owner Type
Purchase Details
Closed on
Aug 25, 2008
Sold by
The Bank Of New York
Bought by
Brooks Kevin E
Current Estimated Value
Home Financials for this Owner
Home Financials are based on the most recent Mortgage that was taken out on this home.
Original Mortgage
$92,618
Outstanding Balance
$60,844
Interest Rate
6.52%
Mortgage Type
FHA
Estimated Equity
$195,968
Purchase Details
Closed on
Jul 2, 2008
Sold by
Johnson Joyce and Johnson Joyce J
Bought by
Bank Of New York and Eqcc Asset Backed Certificates Series 20
Home Financials for this Owner
Home Financials are based on the most recent Mortgage that was taken out on this home.
Original Mortgage
$92,618
Outstanding Balance
$60,844
Interest Rate
6.52%
Mortgage Type
FHA
Estimated Equity
$195,968
Purchase Details
Closed on
Sep 12, 1989
Bought by
Toy Joyce J
Purchase Details
Closed on
Jun 1, 1983
Purchase Details
Closed on
Dec 1, 1978
Create a Home Valuation Report for This Property
The Home Valuation Report is an in-depth analysis detailing your home's value as well as a comparison with similar homes in the area
Home Values in the Area
Average Home Value in this Area
Purchase History
| Date | Buyer | Sale Price | Title Company |
|---|---|---|---|
| Brooks Kevin E | $59,900 | Attorney | |
| Bank Of New York | $62,000 | None Available | |
| Toy Joyce J | -- | -- | |
| -- | $48,900 | -- | |
| -- | $36,500 | -- |
Source: Public Records
Mortgage History
| Date | Status | Borrower | Loan Amount |
|---|---|---|---|
| Open | Brooks Kevin E | $92,618 |
Source: Public Records
Tax History
| Year | Tax Paid | Tax Assessment Tax Assessment Total Assessment is a certain percentage of the fair market value that is determined by local assessors to be the total taxable value of land and additions on the property. | Land | Improvement |
|---|---|---|---|---|
| 2025 | $3,027 | $67,450 | $15,540 | $51,910 |
| 2024 | $3,027 | $67,450 | $15,540 | $51,910 |
| 2023 | $2,988 | $67,445 | $15,540 | $51,905 |
| 2022 | $1,917 | $36,960 | $8,400 | $28,560 |
| 2021 | $1,920 | $36,960 | $8,400 | $28,560 |
| 2020 | $1,923 | $36,960 | $8,400 | $28,560 |
| 2019 | $1,868 | $30,800 | $7,000 | $23,800 |
| 2018 | $1,748 | $30,800 | $7,000 | $23,800 |
| 2017 | $1,832 | $30,800 | $7,000 | $23,800 |
| 2016 | $1,797 | $27,130 | $5,430 | $21,700 |
| 2015 | $1,631 | $27,130 | $5,430 | $21,700 |
| 2014 | $1,635 | $27,130 | $5,430 | $21,700 |
| 2013 | $896 | $30,135 | $6,020 | $24,115 |
Source: Public Records
Map
Nearby Homes
- 2840 Manola Dr
- 1677 Kenview Rd
- 1679 Penfield Rd
- 2813 Kingsrowe Ct Unit 43
- 1637 S James Rd
- 2731 Sonata Dr
- 2639 Halleck Dr
- 2942 Arrowhead Ct
- 1884 Barnett Ct W
- 1455 Wilmore Dr
- 3038 Wadsworth Ct
- 3036 Wadsworth Ct
- 1423 Cottingham Ct E
- 1341 Millerdale Rd
- 3325 E Deshler Ave
- 3285 Scottwood Rd
- 0 Rotunda Dr Unit 271
- 2029 Burwell Dr Unit A
- 2956 Castlewood Rd
- 2278 Wadsworth Dr Unit D
- 1790 Newfield Rd
- 1800 Newfield Rd
- 1804 Newfield Rd
- 1778 Newfield Rd
- 1808 Newfield Rd
- 1783 Newfield Rd
- 1777 Newfield Rd
- 1787 Newfield Rd
- 1793 Newfield Rd
- 1774 Newfield Rd
- 1814 Newfield Rd
- 2879 Proctor Dr
- 1799 Newfield Rd
- 2865 Proctor Dr
- 1803 Newfield Rd
- 1770 Newfield Rd
- 2851 Proctor Dr
- 1818 Newfield Rd
- 2839 Proctor Dr
- 1766 Newfield Rd
Your Personal Tour Guide
Ask me questions while you tour the home.