Estimated Value: $880,118 - $953,000
5
Beds
5
Baths
4,922
Sq Ft
$187/Sq Ft
Est. Value
About This Home
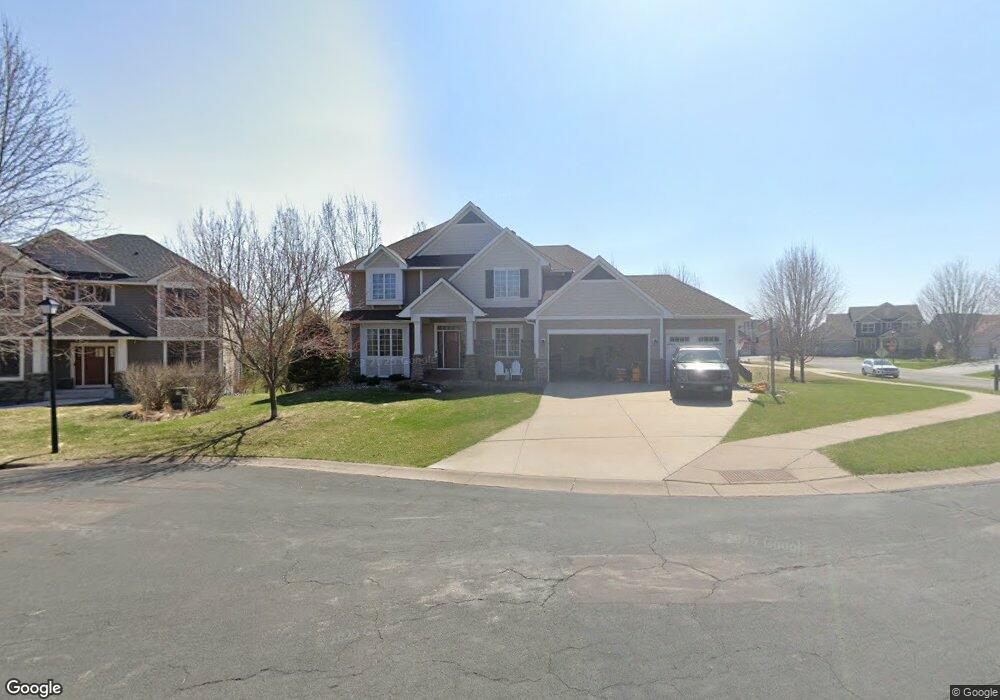
This home is located at 17951 63rd Place N, Osseo, MN 55311 and is currently estimated at $920,030, approximately $186 per square foot. 17951 63rd Place N is a home located in Hennepin County with nearby schools including Wayzata Central Middle School, Wayzata High School, and Ave Maria Academy.
Ownership History
Date
Name
Owned For
Owner Type
Purchase Details
Closed on
Jun 23, 2019
Sold by
Kinkead Chad A and Kinkead Rose M
Bought by
Buckner Nathan and Buckner Alyssa
Current Estimated Value
Home Financials for this Owner
Home Financials are based on the most recent Mortgage that was taken out on this home.
Original Mortgage
$210,000
Outstanding Balance
$67,463
Interest Rate
3.9%
Mortgage Type
Purchase Money Mortgage
Estimated Equity
$852,567
Purchase Details
Closed on
Aug 30, 2010
Sold by
Creek Hill Custom Homes Inc
Bought by
Kinkead Chad A and Kinkead Rose M
Purchase Details
Closed on
Feb 15, 2006
Sold by
Gonyea Development Llc
Bought by
Creek Hill Custom Homes Inc
Create a Home Valuation Report for This Property
The Home Valuation Report is an in-depth analysis detailing your home's value as well as a comparison with similar homes in the area
Home Values in the Area
Average Home Value in this Area
Purchase History
| Date | Buyer | Sale Price | Title Company |
|---|---|---|---|
| Buckner Nathan | $710,000 | Gibraltar Title Agency Llc | |
| Kinkead Chad A | $724,089 | -- | |
| Creek Hill Custom Homes Inc | $7,011,160 | -- |
Source: Public Records
Mortgage History
| Date | Status | Borrower | Loan Amount |
|---|---|---|---|
| Open | Buckner Nathan | $210,000 |
Source: Public Records
Tax History Compared to Growth
Tax History
| Year | Tax Paid | Tax Assessment Tax Assessment Total Assessment is a certain percentage of the fair market value that is determined by local assessors to be the total taxable value of land and additions on the property. | Land | Improvement |
|---|---|---|---|---|
| 2024 | $10,695 | $857,700 | $187,600 | $670,100 |
| 2023 | $10,154 | $855,800 | $184,700 | $671,100 |
| 2022 | $9,349 | $840,200 | $158,200 | $682,000 |
| 2021 | $9,265 | $699,100 | $126,200 | $572,900 |
| 2020 | $9,780 | $689,100 | $135,000 | $554,100 |
| 2019 | $9,334 | $699,200 | $150,500 | $548,700 |
| 2018 | $9,546 | $662,900 | $135,500 | $527,400 |
| 2017 | $9,733 | $668,900 | $180,000 | $488,900 |
| 2016 | $9,911 | $664,300 | $185,000 | $479,300 |
| 2015 | $9,878 | $650,700 | $185,000 | $465,700 |
| 2014 | -- | $613,500 | $185,000 | $428,500 |
Source: Public Records
Map
Nearby Homes
- 6300 Ranier Ln N
- 17716 Elm Rd N
- 6647 Peony Ln N
- 6508 Merrimac Ln N Unit 6508
- 6566 Merrimac Ln N
- 6205 Ranier Ln N
- 17812 66th Ave N
- 17749 62nd Ave N
- 6750 Troy Ln N
- 6287 Fountain Ln N
- 6757 Urbandale Ln N
- 6540 Yellowstone Ln N
- 6848 Troy Ln N
- 6860 Peony Ln N
- 6324 Fountain Ln N
- 17673 69th Place N
- 5989 Xanthus Ln N
- 6165 Garland Ln N
- 1988 Leaping Deer Cir
- 6290 Larkspur Ln
- 17951 17951 63rd-Place-n
- 17923 63rd Place N
- 6338 Queensland Ln N
- 17923 63rd Place N
- 6330 Queensland Ln N
- 6370 Queensland Ln N
- 6324 Queensland Ln N
- 17875 63rd Ave N
- 17875 63rd Ave N
- 17956 63rd Place N
- 17863 63rd Ave N
- 17863 63rd Ave N
- 17930 63rd Place N
- 6331 Queensland Ln N
- 6316 Queensland Ln N
- 6345 Queensland Ln N
- 17887 63rd Ave N
- 17887 63rd Ave N
- 6353 Queensland Ln N
- 6317 Queensland Ln N