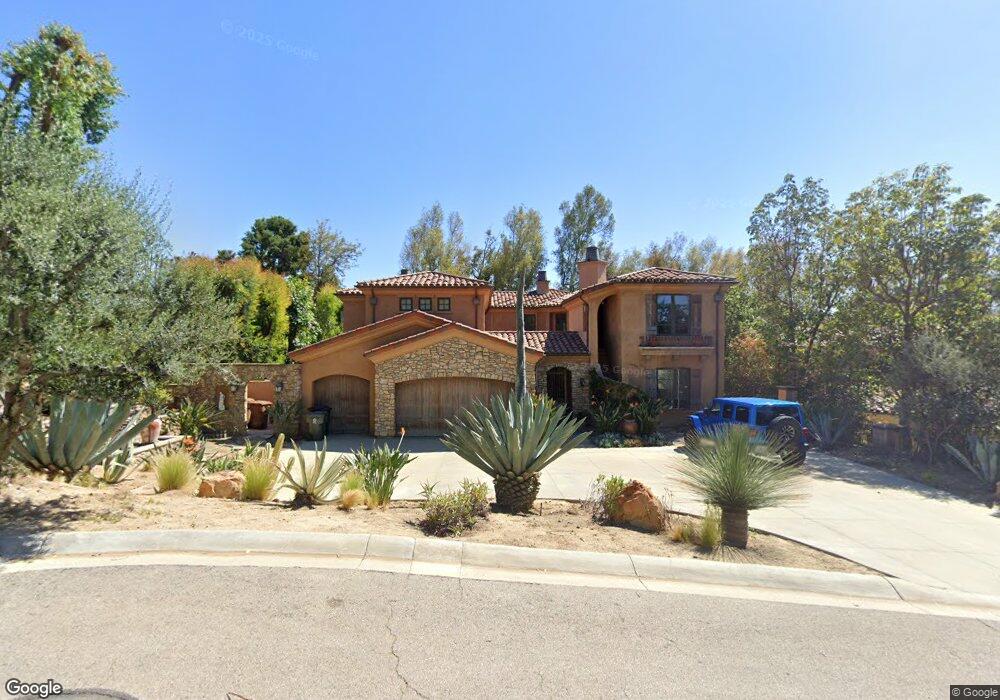
17954 Via Ranchero Yorba Linda, CA 92886
Estimated Value: $2,648,000 - $3,256,000
6
Beds
6
Baths
5,670
Sq Ft
$512/Sq Ft
Est. Value
About This Home
This home is located at 17954 Via Ranchero, Yorba Linda, CA 92886 and is currently estimated at $2,901,879, approximately $511 per square foot. 17954 Via Ranchero is a home located in Orange County with nearby schools including Linda Vista Elementary School, Yorba Linda Middle School, and Friends Christian School.
Ownership History
Date
Name
Owned For
Owner Type
Purchase Details
Closed on
Sep 24, 2009
Sold by
Klepp Gregory J
Bought by
Trimboli Frank and Trimboli Cathy
Current Estimated Value
Home Financials for this Owner
Home Financials are based on the most recent Mortgage that was taken out on this home.
Original Mortgage
$1,100,000
Interest Rate
4.87%
Mortgage Type
New Conventional
Purchase Details
Closed on
Oct 25, 2007
Sold by
Toscano Development Group Llc
Bought by
Klepp Gregory J
Home Financials for this Owner
Home Financials are based on the most recent Mortgage that was taken out on this home.
Original Mortgage
$1,575,000
Interest Rate
6.36%
Mortgage Type
Purchase Money Mortgage
Create a Home Valuation Report for This Property
The Home Valuation Report is an in-depth analysis detailing your home's value as well as a comparison with similar homes in the area
Home Values in the Area
Average Home Value in this Area
Purchase History
| Date | Buyer | Sale Price | Title Company |
|---|---|---|---|
| Trimboli Frank | $1,400,000 | Landwood Title | |
| Klepp Gregory J | -- | Lawyers Title |
Source: Public Records
Mortgage History
| Date | Status | Borrower | Loan Amount |
|---|---|---|---|
| Previous Owner | Trimboli Frank | $1,100,000 | |
| Previous Owner | Klepp Gregory J | $1,575,000 |
Source: Public Records
Tax History Compared to Growth
Tax History
| Year | Tax Paid | Tax Assessment Tax Assessment Total Assessment is a certain percentage of the fair market value that is determined by local assessors to be the total taxable value of land and additions on the property. | Land | Improvement |
|---|---|---|---|---|
| 2025 | $19,296 | $1,807,148 | $554,332 | $1,252,816 |
| 2024 | $19,296 | $1,771,714 | $543,463 | $1,228,251 |
| 2023 | $18,979 | $1,736,975 | $532,807 | $1,204,168 |
| 2022 | $18,838 | $1,702,917 | $522,360 | $1,180,557 |
| 2021 | $18,512 | $1,669,527 | $512,118 | $1,157,409 |
| 2020 | $18,451 | $1,652,409 | $506,867 | $1,145,542 |
| 2019 | $17,781 | $1,620,009 | $496,928 | $1,123,081 |
| 2018 | $17,564 | $1,588,245 | $487,185 | $1,101,060 |
| 2017 | $17,278 | $1,557,103 | $477,632 | $1,079,471 |
| 2016 | $16,926 | $1,526,572 | $468,267 | $1,058,305 |
| 2015 | $16,723 | $1,503,642 | $461,233 | $1,042,409 |
| 2014 | $16,220 | $1,474,188 | $452,198 | $1,021,990 |
Source: Public Records
Map
Nearby Homes
- 6032 Sun Knoll Cir
- 17967 Sun Hill Dr
- 5661 Casa Loma Ave
- 17842 Caballo Dr
- 17841 Buena Vista Ave
- 6052 Candle Light Ln
- 146 Los Alamitos Cir
- 2024 Tanforan Ave
- 2017 Orchard Dr Unit 11
- 1833 Taft Ln
- 1524 Larsen Ln
- 5231 Highland Ave
- 1527 Evans Ln
- 4568 E Meadowhill Ave
- 1958 Avenida Del Sol
- 1963 Via de la Luna
- 1952 Avenida Del Sol
- 5141 Siesta Ln
- 1561 Ismail Place
- 1507 E Spruce St Unit A
- 17944 Via Ranchero
- 17962 Via Ranchero
- 17952 Via Ranchero
- 17934 Via Ranchero
- 17951 Sun Knoll Dr
- 17941 Sun Knoll Dr
- 5793 Highland Ave
- 17961 Sun Knoll Dr
- 17972 Via Ranchero
- 17931 Sun Knoll Dr
- 5815 Highland Ave Unit Studio
- 5815 Highland Ave
- 17924 Via Ranchero
- 17971 Sun Knoll Dr
- 5791 Highland Ave
- 5785 Highland Ave
- 6001 Sun View Rd
- 17822 Seminole Way
- 17982 Via Ranchero
- 17981 Sun Knoll Dr