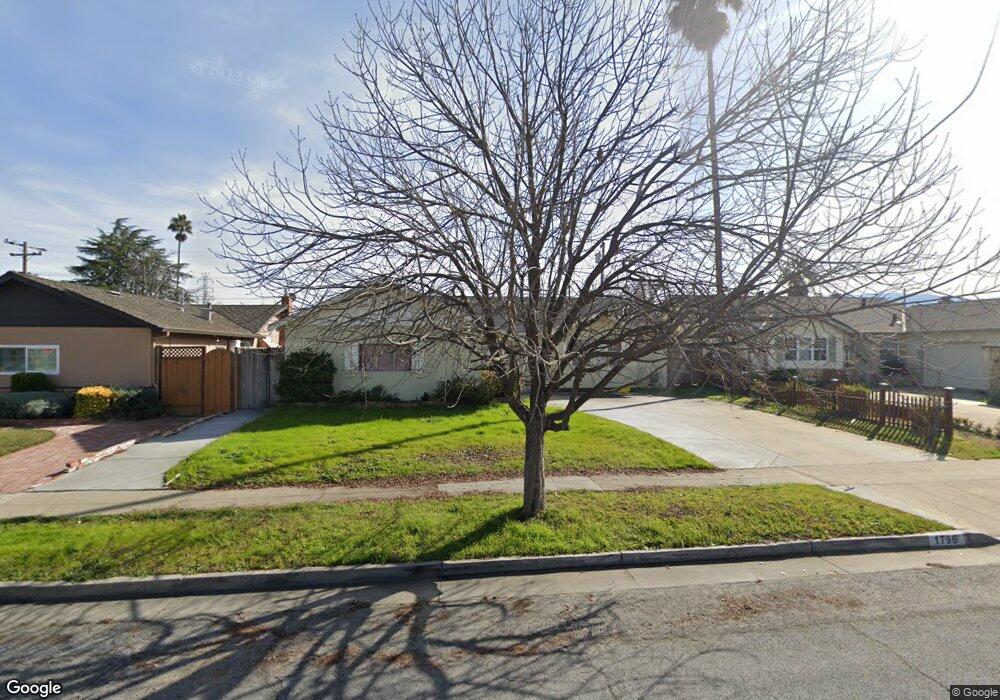
1796 Brighten Ave San Jose, CA 95124
Doerr-Steindorf NeighborhoodEstimated Value: $1,571,000 - $1,696,000
3
Beds
2
Baths
1,480
Sq Ft
$1,091/Sq Ft
Est. Value
About This Home
This home is located at 1796 Brighten Ave, San Jose, CA 95124 and is currently estimated at $1,614,606, approximately $1,090 per square foot. 1796 Brighten Ave is a home located in Santa Clara County with nearby schools including Branham High School, Fammatre Elementary School, and Sartorette Charter School.
Ownership History
Date
Name
Owned For
Owner Type
Purchase Details
Closed on
Mar 6, 2013
Sold by
Singh Christopher Tiller Thiaga and Samuel Pamila
Bought by
Singh Christopher Tiller Thiaga and Samuel Pamila
Current Estimated Value
Home Financials for this Owner
Home Financials are based on the most recent Mortgage that was taken out on this home.
Original Mortgage
$460,000
Outstanding Balance
$323,873
Interest Rate
3.49%
Mortgage Type
New Conventional
Estimated Equity
$1,290,733
Purchase Details
Closed on
Sep 15, 2011
Sold by
Knapp Lynn
Bought by
Singh Christopher T and Samuel Pamila
Home Financials for this Owner
Home Financials are based on the most recent Mortgage that was taken out on this home.
Original Mortgage
$470,268
Interest Rate
4.37%
Mortgage Type
FHA
Create a Home Valuation Report for This Property
The Home Valuation Report is an in-depth analysis detailing your home's value as well as a comparison with similar homes in the area
Home Values in the Area
Average Home Value in this Area
Purchase History
| Date | Buyer | Sale Price | Title Company |
|---|---|---|---|
| Singh Christopher Tiller Thiaga | -- | Chicago Title Company | |
| Singh Christopher T | $482,500 | Chicago Title Company |
Source: Public Records
Mortgage History
| Date | Status | Borrower | Loan Amount |
|---|---|---|---|
| Open | Singh Christopher Tiller Thiaga | $460,000 | |
| Closed | Singh Christopher T | $470,268 |
Source: Public Records
Tax History Compared to Growth
Tax History
| Year | Tax Paid | Tax Assessment Tax Assessment Total Assessment is a certain percentage of the fair market value that is determined by local assessors to be the total taxable value of land and additions on the property. | Land | Improvement |
|---|---|---|---|---|
| 2025 | $8,817 | $606,034 | $424,164 | $181,870 |
| 2024 | $8,817 | $594,152 | $415,848 | $178,304 |
| 2023 | $8,727 | $582,503 | $407,695 | $174,808 |
| 2022 | $8,576 | $571,082 | $399,701 | $171,381 |
| 2021 | $8,379 | $559,885 | $391,864 | $168,021 |
| 2020 | $7,992 | $554,145 | $387,846 | $166,299 |
| 2019 | $7,879 | $543,281 | $380,242 | $163,039 |
| 2018 | $7,661 | $532,630 | $372,787 | $159,843 |
| 2017 | $7,486 | $522,187 | $365,478 | $156,709 |
| 2016 | $7,130 | $511,949 | $358,312 | $153,637 |
| 2015 | $7,040 | $504,260 | $352,930 | $151,330 |
| 2014 | $6,518 | $494,383 | $346,017 | $148,366 |
Source: Public Records
Map
Nearby Homes
- 1795 Foxworthy Ave
- 1828 Nestorita Way
- 2934 Custer Dr
- 2917 Quinto Way
- 3266 Kimber Ct Unit 128
- 1771 Donna Ln
- 3328 Kimber Ct Unit 21
- 1800 Donna Ln
- 2772 Quinto Way
- 1799 Bradford Way
- 3771 Justine Dr
- 1701 Foxworthy Ave
- 3155 Franela Dr
- 3825 Woodford Dr
- 3923 La Mesa Ln
- 2682 Coit Dr
- 3942 Paladin Dr
- 3116 Kathleen St
- 2881 Meridian Ave Unit 264
- 2881 Meridian Ave Unit 217
- 1798 Brighten Ave
- 1794 Brighten Ave
- 1797 Matzley Dr
- 3139 Cyrus Ave
- 1799 Matzley Dr
- 1802 Brighten Ave
- 1797 Karen Ct
- 1801 Matzley Dr
- 1804 Brighten Ave
- 1795 Brighten Ave
- 3124 Cyrus Ave
- 3102 Cyrus Ave
- 1803 Matzley Dr
- 3136 Cyrus Ave
- 1799 Karen Ct
- 3161 Cyrus Ave
- 3082 Cyrus Ave
- 1805 Karen Ct
- 3148 Cyrus Ave
- 3158 Longdale Dr