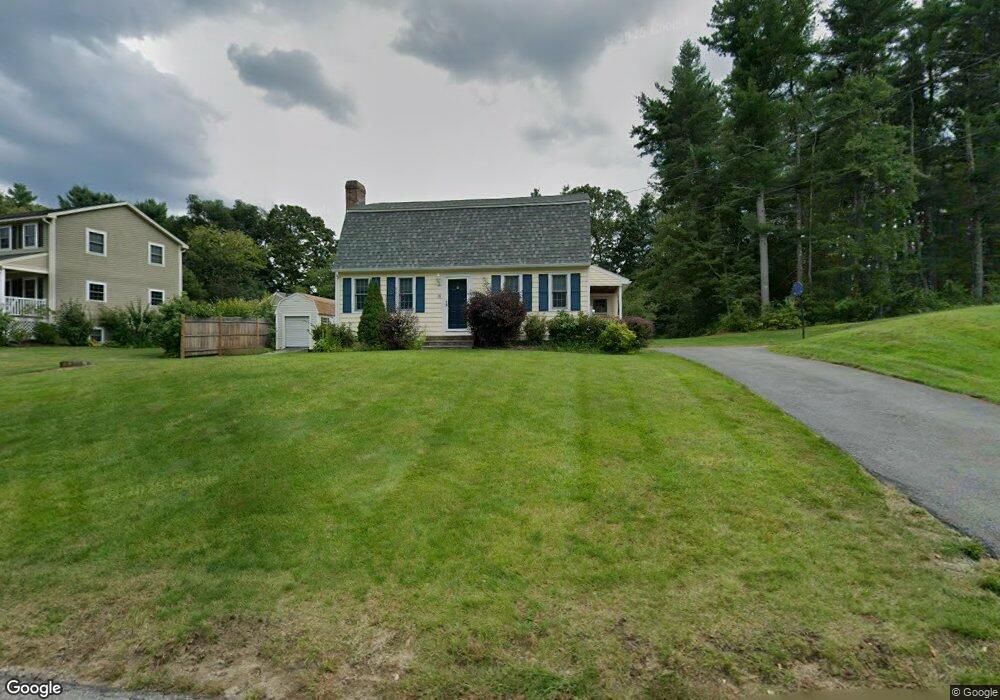
18 Balsam Dr Townsend, MA 01469
Estimated Value: $522,950 - $573,000
3
Beds
2
Baths
2,200
Sq Ft
$251/Sq Ft
Est. Value
About This Home
This home is located at 18 Balsam Dr, Townsend, MA 01469 and is currently estimated at $551,738, approximately $250 per square foot. 18 Balsam Dr is a home located in Middlesex County with nearby schools including North Middlesex Regional High School.
Ownership History
Date
Name
Owned For
Owner Type
Purchase Details
Closed on
Sep 8, 2025
Sold by
Carney Christopher L and Carney Tina M
Bought by
Carney Ft and Carney
Current Estimated Value
Purchase Details
Closed on
Apr 27, 2017
Sold by
Carney Tina M
Bought by
Carney Tina M and Carney Christopher L
Purchase Details
Closed on
Apr 8, 2015
Sold by
Krawczyk Shawn W and Krawczyk Tina M
Bought by
Krawczyk Tina M
Purchase Details
Closed on
Mar 8, 2002
Sold by
Weeks Brian D and Weeks Karen E
Bought by
Krawczyk Shawn W and Krawczyk Tina M
Purchase Details
Closed on
Jun 19, 1987
Sold by
Damren Allen R
Bought by
Weeks Brian D
Create a Home Valuation Report for This Property
The Home Valuation Report is an in-depth analysis detailing your home's value as well as a comparison with similar homes in the area
Home Values in the Area
Average Home Value in this Area
Purchase History
| Date | Buyer | Sale Price | Title Company |
|---|---|---|---|
| Carney Ft | -- | -- | |
| Carney Tina M | -- | -- | |
| Krawczyk Tina M | -- | -- | |
| Krawczyk Shawn W | $260,000 | -- | |
| Weeks Brian D | $156,500 | -- |
Source: Public Records
Mortgage History
| Date | Status | Borrower | Loan Amount |
|---|---|---|---|
| Previous Owner | Weeks Brian D | $36,000 | |
| Previous Owner | Weeks Brian D | $190,000 |
Source: Public Records
Tax History Compared to Growth
Tax History
| Year | Tax Paid | Tax Assessment Tax Assessment Total Assessment is a certain percentage of the fair market value that is determined by local assessors to be the total taxable value of land and additions on the property. | Land | Improvement |
|---|---|---|---|---|
| 2025 | $6,064 | $417,600 | $91,200 | $326,400 |
| 2024 | $5,904 | $409,700 | $91,200 | $318,500 |
| 2023 | $5,814 | $381,000 | $78,700 | $302,300 |
| 2022 | $5,783 | $328,400 | $72,100 | $256,300 |
| 2021 | $5,605 | $305,800 | $71,300 | $234,500 |
| 2020 | $5,432 | $278,300 | $64,600 | $213,700 |
| 2019 | $5,194 | $268,700 | $64,600 | $204,100 |
| 2018 | $4,895 | $241,600 | $58,000 | $183,600 |
| 2017 | $4,622 | $235,000 | $60,900 | $174,100 |
| 2016 | $4,453 | $224,900 | $60,900 | $164,000 |
| 2015 | $4,313 | $225,700 | $67,500 | $158,200 |
| 2014 | $4,119 | $210,500 | $63,400 | $147,100 |
Source: Public Records
Map
Nearby Homes