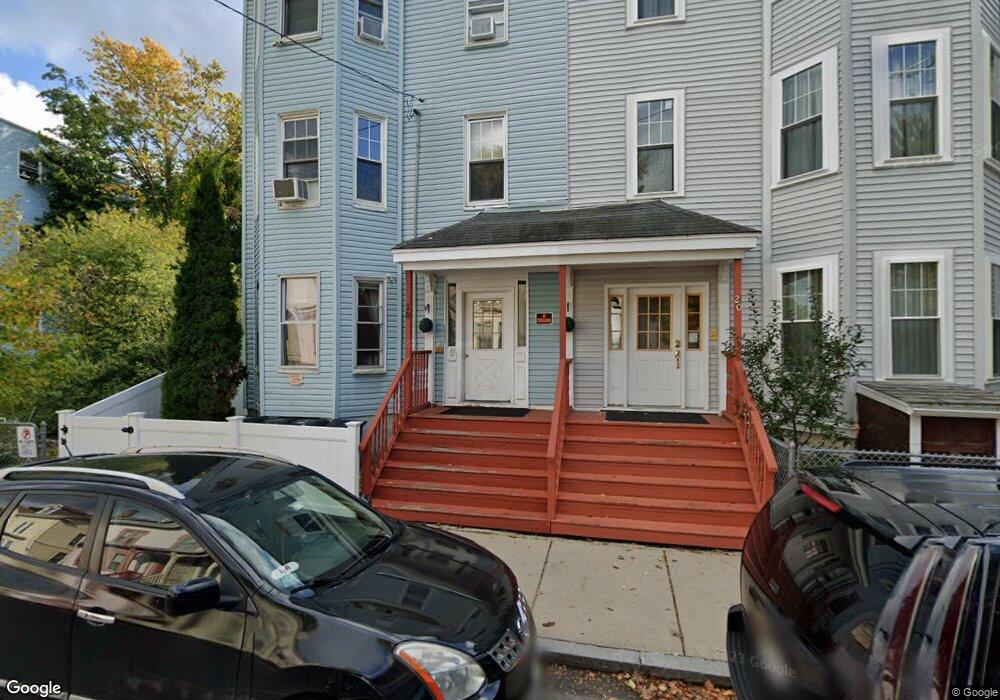
18 Catawba St Unit 3 Roxbury, MA 02119
Washington Park NeighborhoodEstimated Value: $883,000 - $991,558
3
Beds
1
Bath
1,120
Sq Ft
$836/Sq Ft
Est. Value
About This Home
This home is located at 18 Catawba St Unit 3, Roxbury, MA 02119 and is currently estimated at $935,890, approximately $835 per square foot. 18 Catawba St Unit 3 is a home located in Suffolk County with nearby schools including Bridge Boston Charter School and City on a Hill Charter Public School.
Ownership History
Date
Name
Owned For
Owner Type
Purchase Details
Closed on
May 6, 2021
Sold by
Ortiz Flemin
Bought by
Ortiz Flemin and Aquino Yanelis V
Current Estimated Value
Home Financials for this Owner
Home Financials are based on the most recent Mortgage that was taken out on this home.
Original Mortgage
$602,000
Outstanding Balance
$543,237
Interest Rate
3.1%
Mortgage Type
New Conventional
Estimated Equity
$392,653
Purchase Details
Closed on
Jul 1, 2014
Sold by
Tyson Charlie J and Tyson Lillie J
Bought by
Ortiz Flemin
Home Financials for this Owner
Home Financials are based on the most recent Mortgage that was taken out on this home.
Original Mortgage
$455,860
Interest Rate
4.19%
Mortgage Type
New Conventional
Create a Home Valuation Report for This Property
The Home Valuation Report is an in-depth analysis detailing your home's value as well as a comparison with similar homes in the area
Home Values in the Area
Average Home Value in this Area
Purchase History
| Date | Buyer | Sale Price | Title Company |
|---|---|---|---|
| Ortiz Flemin | -- | None Available | |
| Ortiz Flemin | -- | None Available | |
| Ortiz Flemin | $488,000 | -- |
Source: Public Records
Mortgage History
| Date | Status | Borrower | Loan Amount |
|---|---|---|---|
| Open | Ortiz Flemin | $602,000 | |
| Closed | Ortiz Flemin | $602,000 | |
| Previous Owner | Ortiz Flemin | $455,860 |
Source: Public Records
Tax History Compared to Growth
Tax History
| Year | Tax Paid | Tax Assessment Tax Assessment Total Assessment is a certain percentage of the fair market value that is determined by local assessors to be the total taxable value of land and additions on the property. | Land | Improvement |
|---|---|---|---|---|
| 2025 | $8,333 | $719,600 | $190,200 | $529,400 |
| 2024 | $7,449 | $683,400 | $168,800 | $514,600 |
| 2023 | $6,989 | $650,700 | $160,700 | $490,000 |
| 2022 | $6,741 | $619,600 | $153,000 | $466,600 |
| 2021 | $6,122 | $573,800 | $141,700 | $432,100 |
| 2020 | $5,564 | $526,900 | $136,700 | $390,200 |
| 2019 | $4,960 | $470,600 | $98,400 | $372,200 |
| 2018 | $4,566 | $435,700 | $98,400 | $337,300 |
| 2017 | $4,614 | $435,700 | $98,400 | $337,300 |
| 2016 | $4,168 | $378,900 | $98,400 | $280,500 |
| 2015 | $3,331 | $275,100 | $80,500 | $194,600 |
| 2014 | $3,114 | $247,500 | $80,500 | $167,000 |
Source: Public Records
Map
Nearby Homes
- 10 Rockland St Unit 4
- 94 Walnut Ave
- 30 Copeland St Unit 1
- 59 Perrin St
- 59 Perrin St Unit 1
- 7 Langford Park Unit 3
- 62 Clifford St Unit A
- 90 Munroe St
- 31 Alaska St
- 151 Townsend St
- 22 Alaska St
- 99 Harrishof St
- 133 Blue Hill Ave
- 12 Weldon St
- 8 Weldon St
- Lot 84 Blue Hill Ave
- 5 Glenburne St
- 119 Blue Hill Ave
- 33 Copeland Park Unit C
- 16 Mayfair St
- 18 Catawba St
- 20 Catawba St
- 22 Catawba St Unit 24
- 26 Catawba St Unit 28
- 26 Catawba St Unit 2
- 26 Catawba St Unit 1
- 12 Catawba St
- 12 Catawba St Unit 3
- 12 Catawba St Unit 1
- 30 Catawba St
- 34 Catawba St Unit 36
- 21 Catawba St
- 23 Catawba St
- 19 Catawba St
- 25 Catawba St
- 38 Catawba St Unit 40
- 17 Catawba St
- 27 Catawba St Unit 29
- 15 Catawba St
- 42-44 Catawba St