18 Clermont Ct Lancaster, NY 14086
Estimated Value: $505,867 - $566,000
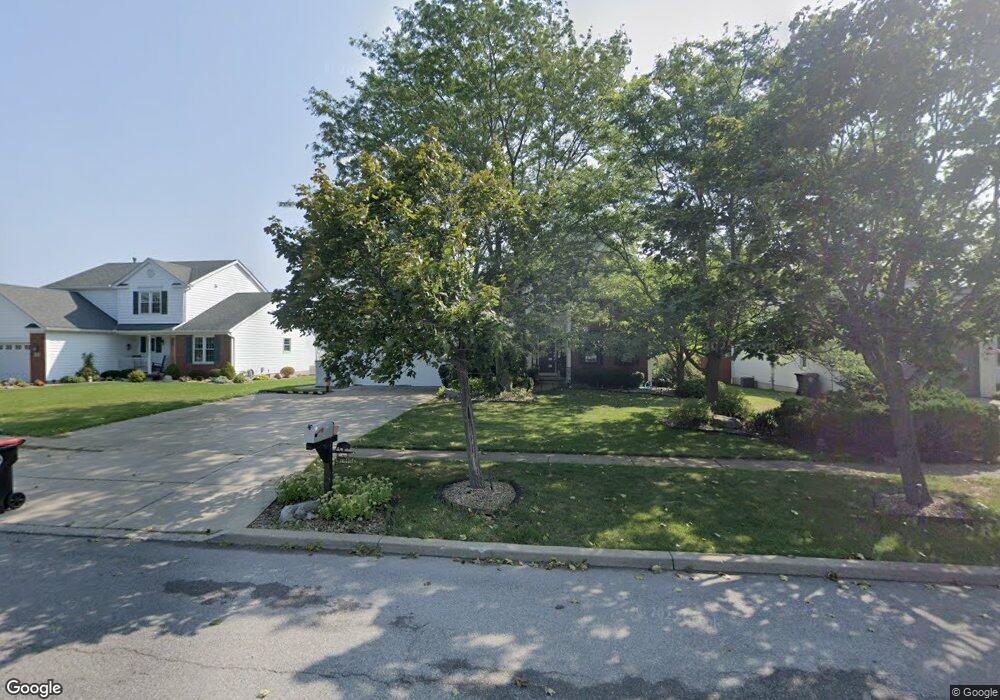
About This Home
This home is located at 18 Clermont Ct, Lancaster, NY 14086 and is currently estimated at $533,467, approximately $243 per square foot. 18 Clermont Ct is a home located in Erie County with nearby schools including William Street School, Lancaster Middle School, and Lancaster High School.
Ownership History
We collect this data history from publicly available records. To have your information removed, we recommend requesting removal directly through your county’s website.
Purchase Details
Purchase Details
Home Financials for this Owner
Home Financials are based on the most recent Mortgage that was taken out on this home.Purchase Details
Purchase Details
Home Values in the Area
Average Home Value in this Area
Purchase History
We collect this data history from publicly available records. To have your information removed, we recommend requesting removal directly through your county’s website.
| Date | Buyer | Sale Price | Title Company |
|---|---|---|---|
| -- | None Available | ||
| $175,500 | William Muehlbauer | ||
| $173,000 | -- | ||
| $32,205 | -- |
Mortgage History
We collect this data history from publicly available records. To have your information removed, we recommend requesting removal directly through your county’s website.
| Date | Status | Borrower | Loan Amount |
|---|---|---|---|
| Open | $149,175 | ||
| Closed | $17,550 |
Tax History
We collect this data history from publicly available records. To have your information removed, we recommend requesting removal directly through your county’s website.
| Year | Tax Paid | Tax Assessment Tax Assessment Total Assessment is a certain percentage of the fair market value that is determined by local assessors to be the total taxable value of land and additions on the property. | Land | Improvement |
|---|---|---|---|---|
| 2025 | $8,260 | $298,000 | $70,000 | $228,000 |
| 2024 | $8,260 | $298,000 | $70,000 | $228,000 |
| 2023 | $8,235 | $298,000 | $70,000 | $228,000 |
| 2022 | $8,008 | $298,000 | $70,000 | $228,000 |
| 2021 | $7,908 | $298,000 | $70,000 | $228,000 |
| 2020 | $7,838 | $298,000 | $70,000 | $228,000 |
| 2019 | $7,314 | $245,000 | $35,000 | $210,000 |
| 2018 | $7,587 | $245,000 | $35,000 | $210,000 |
| 2017 | $3,654 | $245,000 | $35,000 | $210,000 |
| 2016 | $7,339 | $245,000 | $35,000 | $210,000 |
| 2015 | -- | $245,000 | $35,000 | $210,000 |
| 2014 | -- | $245,000 | $35,000 | $210,000 |
Map
- 12 Rollingwood Dr
- 38 Nicholas Ln
- 35 Sagebrush Ln
- 153 Nathans Trail
- 5 Hidden Trail
- 2 Cobblestone Ct
- 209 Nathans Trail
- 2 W Lake Forest Pkwy
- 35 Worthington Ln
- 72 Michaels Walk
- 49 Hemlock Ln
- 17 Old Schoolhouse Rd
- 152 Olde Stone Ln
- 43 Glendale Dr
- 26 Hemlock Ln
- 65 6th Ave
- 47 6th Ave
- 78 Olde Stone Ln
- 372 Aurora St
- 3494 Bowen Rd
Ask me questions while you tour the home.