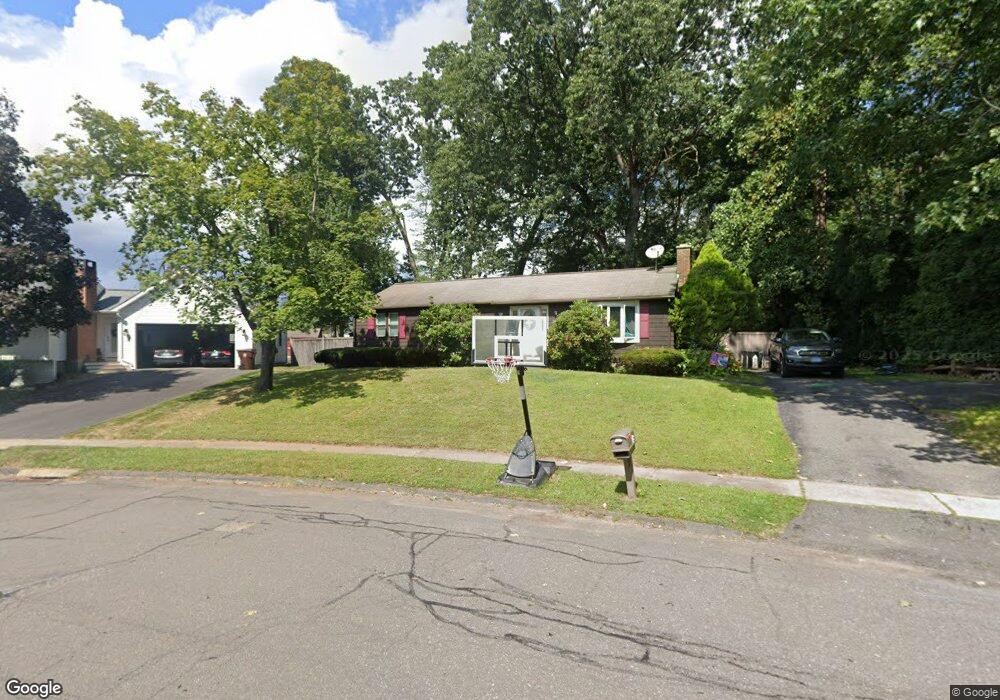
18 Copper Dr Enfield, CT 06082
Estimated Value: $352,764 - $370,000
3
Beds
2
Baths
1,368
Sq Ft
$264/Sq Ft
Est. Value
About This Home
This home is located at 18 Copper Dr, Enfield, CT 06082 and is currently estimated at $360,691, approximately $263 per square foot. 18 Copper Dr is a home located in Hartford County with nearby schools including Edgar H. Parkman School, Enfield Street Elementary School, and John F. Kennedy Middle School.
Ownership History
Date
Name
Owned For
Owner Type
Purchase Details
Closed on
Jan 16, 2004
Sold by
Rock Kenneth and Rock Mary Ann
Bought by
Daly Allison and Daly Colin
Current Estimated Value
Home Financials for this Owner
Home Financials are based on the most recent Mortgage that was taken out on this home.
Original Mortgage
$165,150
Outstanding Balance
$77,663
Interest Rate
5.98%
Estimated Equity
$283,028
Purchase Details
Closed on
May 21, 1997
Sold by
Ford Kenneth and Ford Susan
Bought by
Rock Kenneth and Rock Mary Ann
Home Financials for this Owner
Home Financials are based on the most recent Mortgage that was taken out on this home.
Original Mortgage
$125,460
Interest Rate
8.25%
Mortgage Type
Unknown
Create a Home Valuation Report for This Property
The Home Valuation Report is an in-depth analysis detailing your home's value as well as a comparison with similar homes in the area
Home Values in the Area
Average Home Value in this Area
Purchase History
| Date | Buyer | Sale Price | Title Company |
|---|---|---|---|
| Daly Allison | $183,500 | -- | |
| Rock Kenneth | $123,000 | -- |
Source: Public Records
Mortgage History
| Date | Status | Borrower | Loan Amount |
|---|---|---|---|
| Open | Rock Kenneth | $165,150 | |
| Previous Owner | Rock Kenneth | $125,136 | |
| Previous Owner | Rock Kenneth | $125,460 | |
| Previous Owner | Rock Kenneth | $112,000 |
Source: Public Records
Tax History Compared to Growth
Tax History
| Year | Tax Paid | Tax Assessment Tax Assessment Total Assessment is a certain percentage of the fair market value that is determined by local assessors to be the total taxable value of land and additions on the property. | Land | Improvement |
|---|---|---|---|---|
| 2025 | $5,756 | $164,500 | $58,500 | $106,000 |
| 2024 | $5,601 | $164,500 | $58,500 | $106,000 |
| 2023 | $5,560 | $164,500 | $58,500 | $106,000 |
| 2022 | $5,049 | $164,500 | $58,500 | $106,000 |
| 2021 | $4,758 | $126,780 | $48,480 | $78,300 |
| 2020 | $4,758 | $126,780 | $48,480 | $78,300 |
| 2019 | $4,771 | $126,780 | $48,480 | $78,300 |
| 2018 | $4,691 | $126,780 | $48,480 | $78,300 |
| 2017 | $4,428 | $126,780 | $48,480 | $78,300 |
| 2016 | $4,285 | $124,880 | $48,480 | $76,400 |
| 2015 | $4,151 | $124,880 | $48,480 | $76,400 |
| 2014 | $4,044 | $124,880 | $48,480 | $76,400 |
Source: Public Records
Map
Nearby Homes