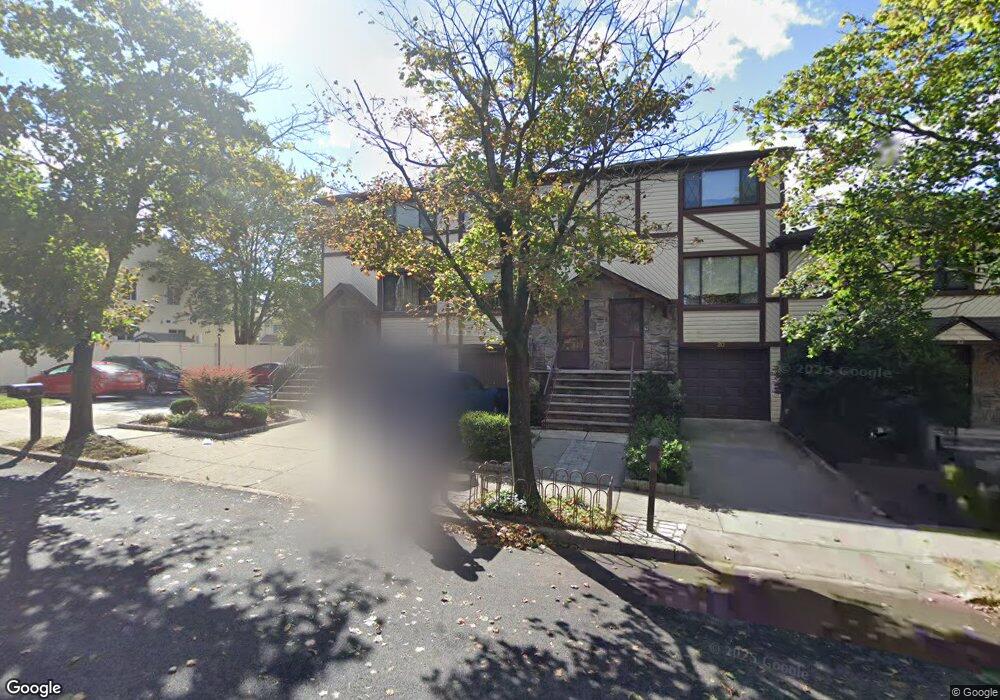
18 Darcey Ave Unit 15 Staten Island, NY 10314
Willowbrook NeighborhoodEstimated Value: $577,000 - $672,000
3
Beds
3
Baths
1,776
Sq Ft
$352/Sq Ft
Est. Value
About This Home
This home is located at 18 Darcey Ave Unit 15, Staten Island, NY 10314 and is currently estimated at $624,309, approximately $351 per square foot. 18 Darcey Ave Unit 15 is a home located in Richmond County with nearby schools including P.S. 54 Charles W Leng, Is 72 Rocco Laurie, and Susan E Wagner High School.
Ownership History
Date
Name
Owned For
Owner Type
Purchase Details
Closed on
Oct 13, 2016
Sold by
Reveron Javier and Stergio Jennifer
Bought by
Gantz Ezra and Gantz Ester M
Current Estimated Value
Home Financials for this Owner
Home Financials are based on the most recent Mortgage that was taken out on this home.
Original Mortgage
$364,500
Outstanding Balance
$292,308
Interest Rate
3.47%
Mortgage Type
New Conventional
Estimated Equity
$332,001
Purchase Details
Closed on
Apr 5, 2006
Sold by
Edelstein Jeanette S
Bought by
Stergio Jennifer and Reveron Javier
Home Financials for this Owner
Home Financials are based on the most recent Mortgage that was taken out on this home.
Original Mortgage
$309,600
Interest Rate
6.4%
Mortgage Type
Fannie Mae Freddie Mac
Purchase Details
Closed on
Jan 12, 1994
Sold by
Edelstein Robert and Edelstein Jeanette S
Bought by
Edelstein Jeanette S
Create a Home Valuation Report for This Property
The Home Valuation Report is an in-depth analysis detailing your home's value as well as a comparison with similar homes in the area
Home Values in the Area
Average Home Value in this Area
Purchase History
| Date | Buyer | Sale Price | Title Company |
|---|---|---|---|
| Gantz Ezra | $407,000 | None Available | |
| Stergio Jennifer | $387,000 | None Available | |
| Edelstein Jeanette S | -- | Chicago Title Insurance Co |
Source: Public Records
Mortgage History
| Date | Status | Borrower | Loan Amount |
|---|---|---|---|
| Open | Gantz Ezra | $364,500 | |
| Previous Owner | Stergio Jennifer | $309,600 |
Source: Public Records
Tax History Compared to Growth
Tax History
| Year | Tax Paid | Tax Assessment Tax Assessment Total Assessment is a certain percentage of the fair market value that is determined by local assessors to be the total taxable value of land and additions on the property. | Land | Improvement |
|---|---|---|---|---|
| 2025 | $4,689 | $38,416 | $2,074 | $36,342 |
| 2024 | $4,689 | $34,510 | $2,231 | $32,279 |
| 2023 | $4,594 | $22,618 | $2,321 | $20,297 |
| 2022 | $4,260 | $28,620 | $3,298 | $25,322 |
| 2021 | $4,237 | $22,914 | $3,298 | $19,616 |
| 2020 | $4,261 | $23,949 | $3,298 | $20,651 |
| 2019 | $4,070 | $20,829 | $3,298 | $17,531 |
| 2018 | $3,842 | $18,848 | $3,033 | $15,815 |
| 2017 | $3,625 | $17,782 | $3,105 | $14,677 |
| 2016 | $3,141 | $16,777 | $3,047 | $13,730 |
| 2015 | $2,919 | $16,777 | $3,094 | $13,683 |
| 2014 | $2,919 | $16,214 | $2,790 | $13,424 |
Source: Public Records
Map
Nearby Homes
- 35 Dreyer Ave Unit 7
- 37 Dreyer Ave Unit A
- 58 Darcey Ave
- 777-805 Willowbrook Rd
- 251 Cambridge Ave
- 664 S Gannon Ave
- 27 Bascom Place
- 490 Collfield Ave
- 0 Woodward Ave
- 40 Parkview Loop
- 132 Parkview Loop Unit 85
- 469 Willow Rd E Unit 1
- 17 Parkview Loop Unit 1041
- 17 Parkview Loop
- 15 Parkview Loop
- 592 Woolley Ave
- 360 Caswell Ave
- 443 Willow Rd E
- 443 Willow Rd E Unit 1
- 591 Woolley Ave
- 20 Darcey Ave
- 22 Darcey Ave
- 24 Darcey Ave Unit 12
- 377 Hawthorne Ave Unit 23
- 27 Dreyer Ave
- 21 Dreyer Ave
- 16 Darcey Ave
- 363 Hawthorne Ave Unit 363
- 361 Hawthorne Ave Unit 10
- 10 Darcey Ave
- 10A Darcey Ave
- 23 Dreyer Ave Unit 18
- 25 Dreyer Ave Unit 19
- 375 Hawthorne Ave
- 29 Dreyer Ave Unit 21
- 9B Darcey Ave Unit 8X
- 9 Darcey Ave Unit 7X
- 7 Darcey Ave Unit 6X
- 7 Darcey Ave Unit 5X
- 8 Darcey Ave