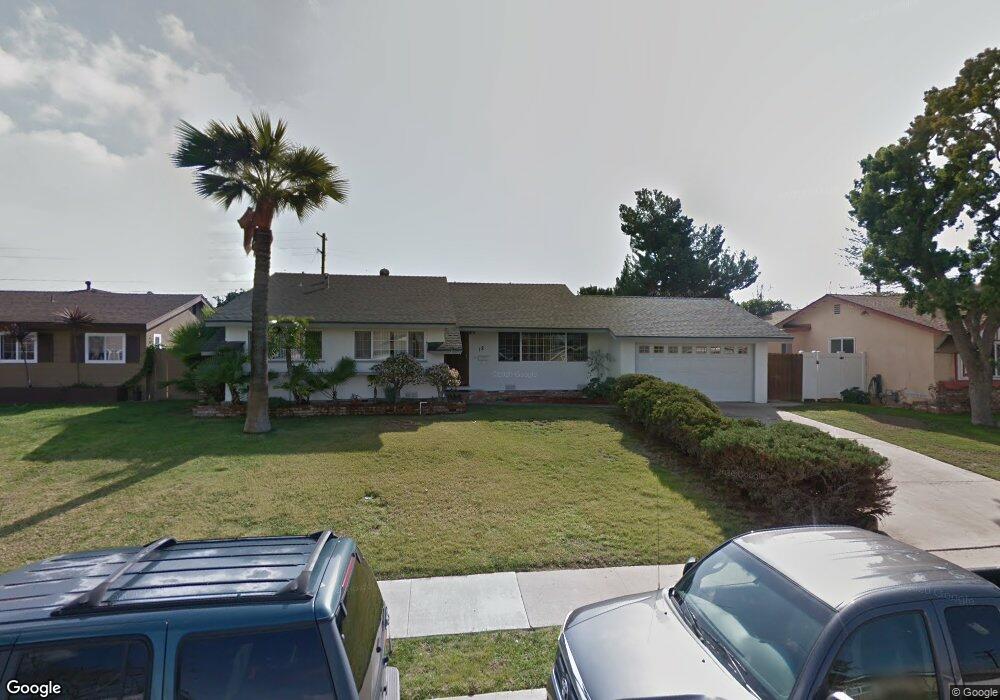
18 E San Miguel Dr Chula Vista, CA 91911
Hilltop NeighborhoodEstimated Value: $771,488 - $834,000
3
Beds
2
Baths
1,300
Sq Ft
$610/Sq Ft
Est. Value
About This Home
This home is located at 18 E San Miguel Dr, Chula Vista, CA 91911 and is currently estimated at $792,872, approximately $609 per square foot. 18 E San Miguel Dr is a home located in San Diego County with nearby schools including Cook Elementary School, Hilltop Middle School, and Hilltop Senior High School.
Ownership History
Date
Name
Owned For
Owner Type
Purchase Details
Closed on
Jul 30, 2001
Sold by
Value T Sales Inc
Bought by
Oneill John W and Oneill Joyce E
Current Estimated Value
Home Financials for this Owner
Home Financials are based on the most recent Mortgage that was taken out on this home.
Original Mortgage
$75,000
Outstanding Balance
$29,341
Interest Rate
7.19%
Estimated Equity
$763,531
Purchase Details
Closed on
Mar 13, 2001
Sold by
Diggins Ted J
Bought by
Value T Sales Inc
Purchase Details
Closed on
Aug 25, 1995
Sold by
Howell Dottie Ann
Bought by
Howell Larry
Home Financials for this Owner
Home Financials are based on the most recent Mortgage that was taken out on this home.
Original Mortgage
$143,610
Interest Rate
7.5%
Mortgage Type
FHA
Purchase Details
Closed on
Jul 12, 1995
Sold by
Howell Larry
Bought by
Diggins Ted J
Home Financials for this Owner
Home Financials are based on the most recent Mortgage that was taken out on this home.
Original Mortgage
$143,610
Interest Rate
7.5%
Mortgage Type
FHA
Purchase Details
Closed on
May 11, 1995
Sold by
Magley Karen Marie
Bought by
Howell Larry
Create a Home Valuation Report for This Property
The Home Valuation Report is an in-depth analysis detailing your home's value as well as a comparison with similar homes in the area
Home Values in the Area
Average Home Value in this Area
Purchase History
| Date | Buyer | Sale Price | Title Company |
|---|---|---|---|
| Oneill John W | $270,000 | United Title Company | |
| Value T Sales Inc | $165,277 | -- | |
| Howell Larry | -- | Southland Title | |
| Diggins Ted J | $146,000 | Southland Title | |
| Howell Larry | $100,000 | First American Title Co |
Source: Public Records
Mortgage History
| Date | Status | Borrower | Loan Amount |
|---|---|---|---|
| Open | Oneill John W | $75,000 | |
| Previous Owner | Diggins Ted J | $143,610 |
Source: Public Records
Tax History Compared to Growth
Tax History
| Year | Tax Paid | Tax Assessment Tax Assessment Total Assessment is a certain percentage of the fair market value that is determined by local assessors to be the total taxable value of land and additions on the property. | Land | Improvement |
|---|---|---|---|---|
| 2025 | $4,523 | $398,847 | $147,720 | $251,127 |
| 2024 | $4,523 | $391,027 | $144,824 | $246,203 |
| 2023 | $4,460 | $383,361 | $141,985 | $241,376 |
| 2022 | $4,330 | $375,845 | $139,201 | $236,644 |
| 2021 | $4,229 | $368,476 | $136,472 | $232,004 |
| 2020 | $4,127 | $364,699 | $135,073 | $229,626 |
| 2019 | $4,019 | $357,549 | $132,425 | $225,124 |
| 2018 | $3,956 | $350,539 | $129,829 | $220,710 |
| 2017 | $10 | $343,667 | $127,284 | $216,383 |
| 2016 | $3,780 | $336,930 | $124,789 | $212,141 |
| 2015 | $3,725 | $331,870 | $122,915 | $208,955 |
| 2014 | $3,662 | $325,370 | $120,508 | $204,862 |
Source: Public Records
Map
Nearby Homes
- 0 Telegraph Canyon Rd Unit PTP2500640
- 920 Evans Ave
- 158 E L St
- 151 Camino Vista Real
- 974 Helix Ave
- 166 Camino Vista Real
- 883 Monserate Ave
- 205 Camlau Dr Unit C
- 174 K St
- 647 Claire Ave
- 202 E J St
- 172 Inkopah St
- 122 King St
- 62 Country Club Cir
- 859 Tamayo Dr Unit 1
- 859 Tamayo Dr Unit 2
- 820 Tamayo Dr Unit 2
- 803 Tamayo Dr Unit 1
- 514 Avenida Centro Unit 105
- 139 139 1/2 Woodlawn Ave
- 24 E San Miguel Dr
- 12 E San Miguel Dr
- 17 E Sierra Way
- 25 Sierra Way
- 11 E Sierra Way Unit B
- 11 E Sierra Way
- 25 E Sierra Way
- 30 E San Miguel Dr
- 17 E San Miguel Dr
- 23 E San Miguel Dr
- 31 Sierra Way
- 31 E Sierra Way
- 4 E San Miguel Dr
- 11 E San Miguel Dr
- 27 E San Miguel Dr
- 5 E Sierra Way
- 36 E San Miguel Dr
- 37 Sierra Way
- 37 E Sierra Way
- 5 E San Miguel Dr