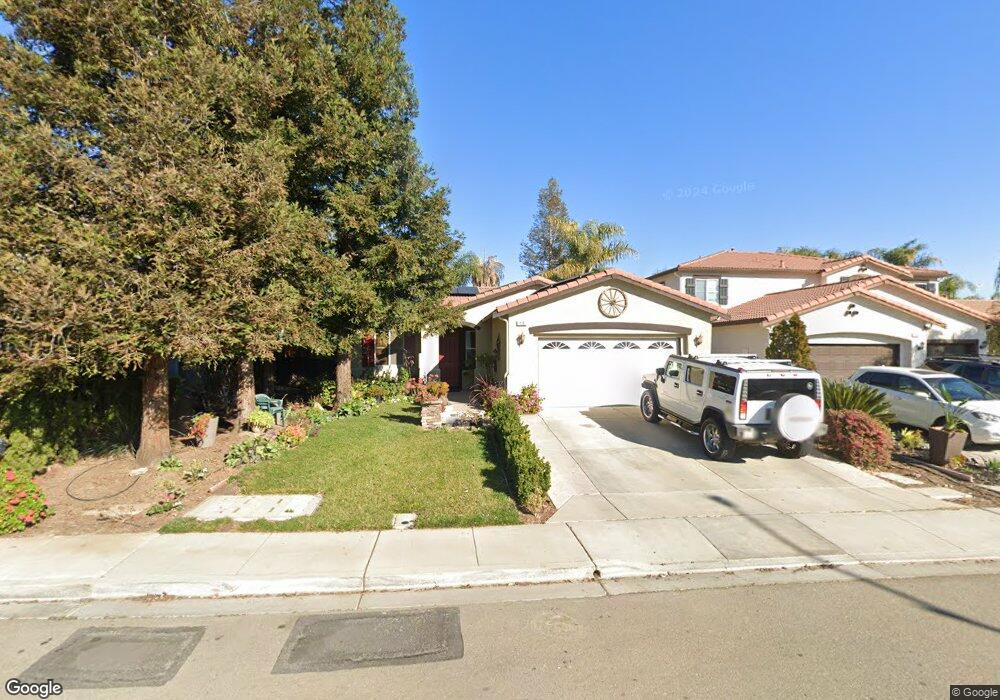
18 Fuller Ct Oakley, CA 94561
South Oakley NeighborhoodEstimated Value: $555,000 - $645,000
4
Beds
2
Baths
1,569
Sq Ft
$384/Sq Ft
Est. Value
About This Home
This home is located at 18 Fuller Ct, Oakley, CA 94561 and is currently estimated at $602,729, approximately $384 per square foot. 18 Fuller Ct is a home located in Contra Costa County with nearby schools including Gehringer Elementary School, Delta Vista Middle School, and Freedom High School.
Ownership History
Date
Name
Owned For
Owner Type
Purchase Details
Closed on
Aug 15, 2016
Sold by
Fannie Mae
Bought by
Salas Leonardo and Salas Natalia
Current Estimated Value
Home Financials for this Owner
Home Financials are based on the most recent Mortgage that was taken out on this home.
Original Mortgage
$380,972
Outstanding Balance
$303,283
Interest Rate
3.41%
Mortgage Type
FHA
Estimated Equity
$299,446
Purchase Details
Closed on
Jan 25, 2016
Sold by
Zamora David and Zamora Stacye
Bought by
Federal National Mortgage Association
Purchase Details
Closed on
May 28, 2002
Sold by
Kb Home South Bay Inc
Bought by
Zamora David S and Zamora Stayce
Home Financials for this Owner
Home Financials are based on the most recent Mortgage that was taken out on this home.
Original Mortgage
$236,572
Interest Rate
5.95%
Mortgage Type
FHA
Create a Home Valuation Report for This Property
The Home Valuation Report is an in-depth analysis detailing your home's value as well as a comparison with similar homes in the area
Home Values in the Area
Average Home Value in this Area
Purchase History
| Date | Buyer | Sale Price | Title Company |
|---|---|---|---|
| Salas Leonardo | $388,000 | Servicelink | |
| Federal National Mortgage Association | $350,000 | None Available | |
| Zamora David S | $240,000 | First American Title |
Source: Public Records
Mortgage History
| Date | Status | Borrower | Loan Amount |
|---|---|---|---|
| Open | Salas Leonardo | $380,972 | |
| Previous Owner | Zamora David S | $236,572 |
Source: Public Records
Tax History
| Year | Tax Paid | Tax Assessment Tax Assessment Total Assessment is a certain percentage of the fair market value that is determined by local assessors to be the total taxable value of land and additions on the property. | Land | Improvement |
|---|---|---|---|---|
| 2025 | $6,682 | $450,300 | $99,227 | $351,073 |
| 2024 | $6,472 | $441,472 | $97,282 | $344,190 |
| 2023 | $6,472 | $432,817 | $95,375 | $337,442 |
| 2022 | $6,390 | $424,331 | $93,505 | $330,826 |
| 2021 | $6,264 | $416,012 | $91,672 | $324,340 |
| 2019 | $5,962 | $403,675 | $88,954 | $314,721 |
| 2018 | $5,798 | $395,760 | $87,210 | $308,550 |
| 2017 | $5,730 | $388,000 | $85,500 | $302,500 |
| 2016 | $4,748 | $317,518 | $110,105 | $207,413 |
| 2015 | $4,757 | $312,750 | $108,452 | $204,298 |
| 2014 | $4,695 | $306,625 | $106,328 | $200,297 |
Source: Public Records
Map
Nearby Homes
- 34 Fuller Ct
- 13 Kearsti Ct
- 190 Raye Ave
- 433 Ramos Ranch Rd
- 1226 Sierra Trail Rd
- 81 Yula Way
- 75 E Bolton Rd Unit 29
- 109 Muir Ct
- 629 Pipa Ln
- 471 Delta Rd
- 25 Solitude Ct
- 1210 Quail Valley Run
- 353 Barn Dance Way
- 4785 Mammouth Ln
- 617 Copper Ridge Way
- 30 Renoir Ct
- 671 Channel Cir
- 672 Channel Cir
- 614 Channel Cir
- 618 Channel Cir
Your Personal Tour Guide
Ask me questions while you tour the home.