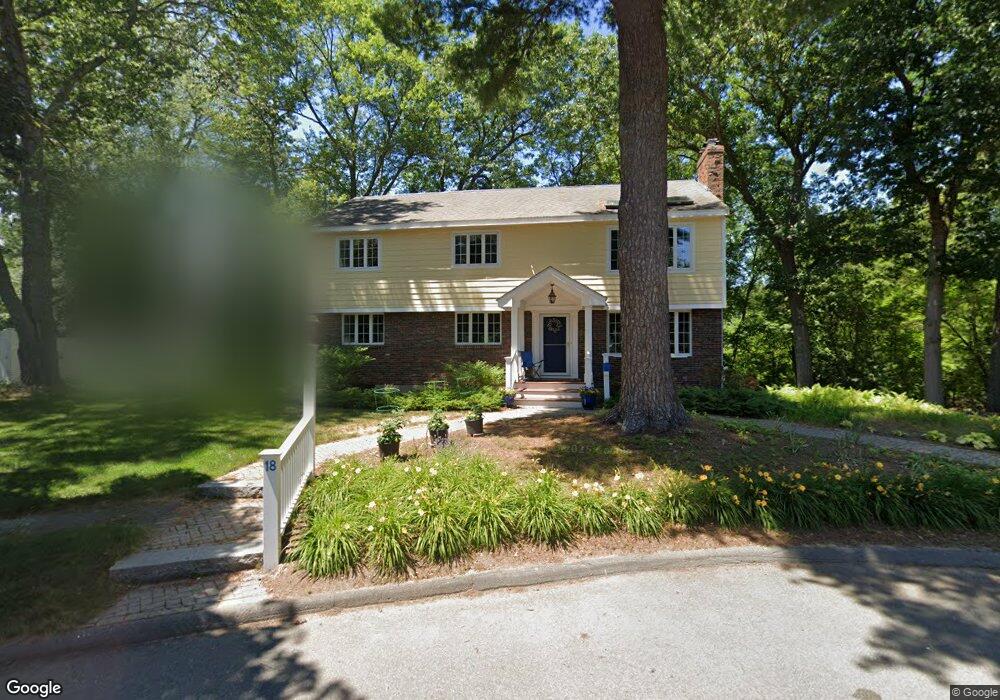
18 Hull Dr Saugus, MA 01906
Downtown Saugus NeighborhoodEstimated Value: $847,242 - $1,333,000
3
Beds
3
Baths
2,565
Sq Ft
$385/Sq Ft
Est. Value
About This Home
This home is located at 18 Hull Dr, Saugus, MA 01906 and is currently estimated at $988,061, approximately $385 per square foot. 18 Hull Dr is a home located in Essex County with nearby schools including Saugus High School and Pioneer Charter School Of Science II.
Ownership History
Date
Name
Owned For
Owner Type
Purchase Details
Closed on
Nov 16, 2020
Sold by
Newman William J and Newman Mary B
Bought by
M B Newman Ft
Current Estimated Value
Purchase Details
Closed on
Dec 14, 1987
Sold by
Weiner David M
Bought by
Newman William J
Home Financials for this Owner
Home Financials are based on the most recent Mortgage that was taken out on this home.
Original Mortgage
$260,000
Interest Rate
10.96%
Mortgage Type
Purchase Money Mortgage
Create a Home Valuation Report for This Property
The Home Valuation Report is an in-depth analysis detailing your home's value as well as a comparison with similar homes in the area
Home Values in the Area
Average Home Value in this Area
Purchase History
| Date | Buyer | Sale Price | Title Company |
|---|---|---|---|
| M B Newman Ft | -- | None Available | |
| Newman William J | $270,000 | -- |
Source: Public Records
Mortgage History
| Date | Status | Borrower | Loan Amount |
|---|---|---|---|
| Previous Owner | Newman William J | $260,000 |
Source: Public Records
Tax History
| Year | Tax Paid | Tax Assessment Tax Assessment Total Assessment is a certain percentage of the fair market value that is determined by local assessors to be the total taxable value of land and additions on the property. | Land | Improvement |
|---|---|---|---|---|
| 2025 | $7,918 | $741,400 | $347,400 | $394,000 |
| 2024 | $7,616 | $715,100 | $329,300 | $385,800 |
| 2023 | $7,495 | $665,600 | $301,400 | $364,200 |
| 2022 | $6,795 | $565,800 | $257,100 | $308,700 |
| 2021 | $6,571 | $532,500 | $223,800 | $308,700 |
| 2020 | $5,958 | $499,800 | $203,000 | $296,800 |
| 2019 | $5,904 | $484,700 | $203,000 | $281,700 |
| 2018 | $5,563 | $480,400 | $203,000 | $277,400 |
| 2017 | $5,354 | $444,300 | $189,500 | $254,800 |
| 2016 | $4,737 | $388,300 | $161,400 | $226,900 |
| 2015 | $4,445 | $369,800 | $153,700 | $216,100 |
| 2014 | $4,449 | $383,200 | $153,700 | $229,500 |
Source: Public Records
Map
Nearby Homes
Your Personal Tour Guide
Ask me questions while you tour the home.