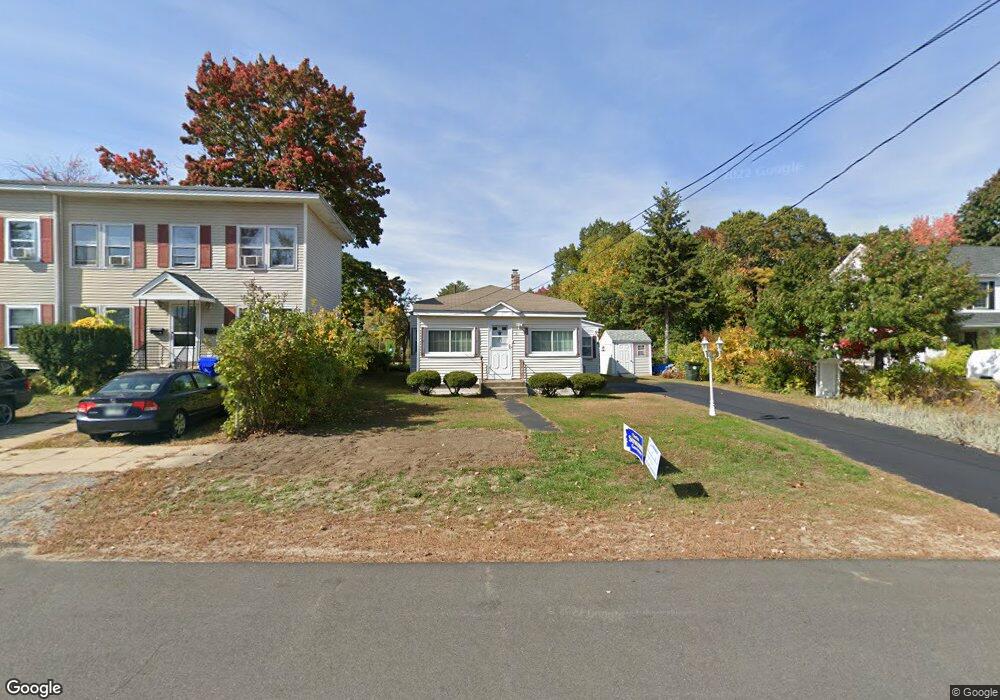
18 Jackson St Manchester, NH 03102
Mast Road NeighborhoodEstimated Value: $336,764 - $376,000
2
Beds
1
Bath
744
Sq Ft
$482/Sq Ft
Est. Value
About This Home
This home is located at 18 Jackson St, Manchester, NH 03102 and is currently estimated at $358,941, approximately $482 per square foot. 18 Jackson St is a home located in Hillsborough County with nearby schools including Parker-Varney School, Middle School at Parkside, and Manchester West High School.
Ownership History
Date
Name
Owned For
Owner Type
Purchase Details
Closed on
Aug 20, 2003
Sold by
Bwc Realty
Bought by
Bergevin Jerry E
Current Estimated Value
Home Financials for this Owner
Home Financials are based on the most recent Mortgage that was taken out on this home.
Original Mortgage
$125,600
Outstanding Balance
$54,906
Interest Rate
5.52%
Estimated Equity
$304,035
Purchase Details
Closed on
Jun 2, 2003
Sold by
Regina C Madison T
Bought by
Bwc Rlty
Home Financials for this Owner
Home Financials are based on the most recent Mortgage that was taken out on this home.
Original Mortgage
$70,000
Interest Rate
5.86%
Create a Home Valuation Report for This Property
The Home Valuation Report is an in-depth analysis detailing your home's value as well as a comparison with similar homes in the area
Home Values in the Area
Average Home Value in this Area
Purchase History
| Date | Buyer | Sale Price | Title Company |
|---|---|---|---|
| Bergevin Jerry E | $159,900 | -- | |
| Bwc Rlty | $125,000 | -- |
Source: Public Records
Mortgage History
| Date | Status | Borrower | Loan Amount |
|---|---|---|---|
| Open | Bwc Rlty | $15,000 | |
| Open | Bwc Rlty | $125,600 | |
| Previous Owner | Bwc Rlty | $70,000 |
Source: Public Records
Tax History Compared to Growth
Tax History
| Year | Tax Paid | Tax Assessment Tax Assessment Total Assessment is a certain percentage of the fair market value that is determined by local assessors to be the total taxable value of land and additions on the property. | Land | Improvement |
|---|---|---|---|---|
| 2024 | $4,116 | $210,200 | $90,700 | $119,500 |
| 2023 | $3,964 | $210,200 | $90,700 | $119,500 |
| 2022 | $3,834 | $210,200 | $90,700 | $119,500 |
| 2021 | $3,716 | $210,200 | $90,700 | $119,500 |
| 2020 | $3,484 | $141,300 | $62,500 | $78,800 |
| 2019 | $3,436 | $141,300 | $62,500 | $78,800 |
| 2018 | $3,346 | $141,300 | $62,500 | $78,800 |
| 2017 | $3,295 | $141,300 | $62,500 | $78,800 |
| 2016 | $3,270 | $141,300 | $62,500 | $78,800 |
| 2015 | $3,282 | $140,000 | $62,500 | $77,500 |
| 2014 | $3,339 | $142,100 | $62,500 | $79,600 |
| 2013 | $3,221 | $142,100 | $62,500 | $79,600 |
Source: Public Records
Map
Nearby Homes