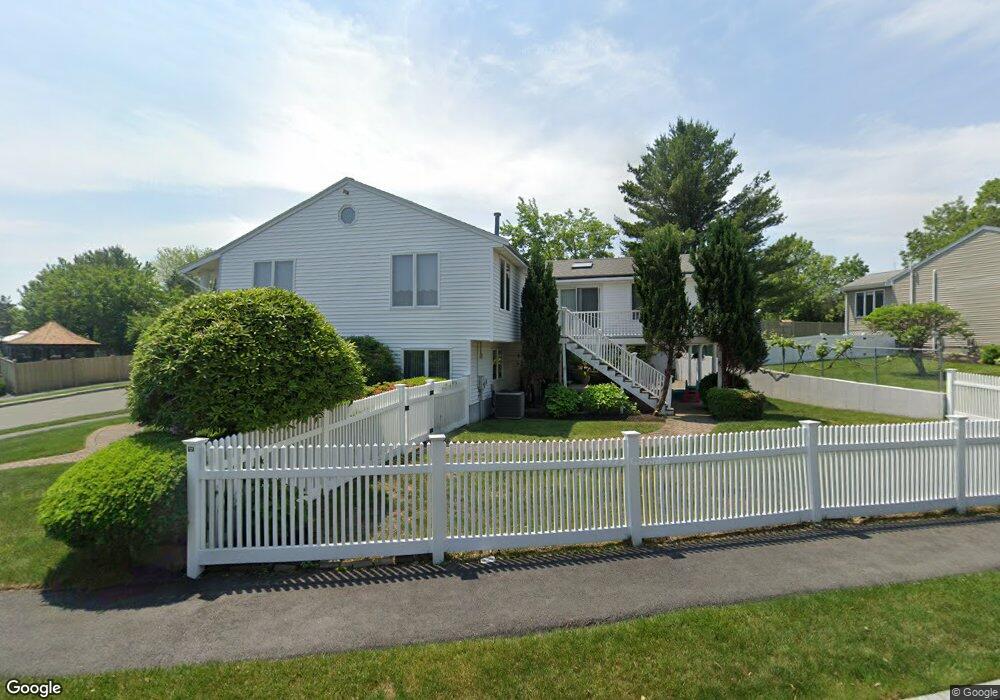
18 John Rd Peabody, MA 01960
South Peabody NeighborhoodEstimated Value: $901,800 - $1,032,000
4
Beds
2
Baths
3,072
Sq Ft
$321/Sq Ft
Est. Value
About This Home
This home is located at 18 John Rd, Peabody, MA 01960 and is currently estimated at $986,200, approximately $321 per square foot. 18 John Rd is a home located in Essex County with nearby schools including Peabody Veterans Memorial High School, St John The Baptist School, and Our Lady Of Assumption School.
Ownership History
Date
Name
Owned For
Owner Type
Purchase Details
Closed on
May 16, 2023
Sold by
Scangas Angelo G and Scangas Stephanie A
Bought by
Angelo G Scangas 2023 Ret
Current Estimated Value
Purchase Details
Closed on
Jun 14, 1988
Sold by
Oak Hill Rt
Bought by
Scangas Angelo G
Create a Home Valuation Report for This Property
The Home Valuation Report is an in-depth analysis detailing your home's value as well as a comparison with similar homes in the area
Home Values in the Area
Average Home Value in this Area
Purchase History
| Date | Buyer | Sale Price | Title Company |
|---|---|---|---|
| Angelo G Scangas 2023 Ret | -- | None Available | |
| Scangas Angelo G | $230,000 | -- |
Source: Public Records
Mortgage History
| Date | Status | Borrower | Loan Amount |
|---|---|---|---|
| Previous Owner | Scangas Angelo G | $400,000 | |
| Previous Owner | Scangas Angelo G | $300,000 | |
| Previous Owner | Scangas Angelo G | $150,000 |
Source: Public Records
Tax History
| Year | Tax Paid | Tax Assessment Tax Assessment Total Assessment is a certain percentage of the fair market value that is determined by local assessors to be the total taxable value of land and additions on the property. | Land | Improvement |
|---|---|---|---|---|
| 2025 | $8,331 | $899,700 | $299,400 | $600,300 |
| 2024 | $8,016 | $879,000 | $299,400 | $579,600 |
| 2023 | $7,193 | $755,600 | $249,500 | $506,100 |
| 2022 | $6,771 | $670,400 | $217,000 | $453,400 |
| 2021 | $6,636 | $632,600 | $197,200 | $435,400 |
| 2020 | $6,790 | $632,200 | $197,200 | $435,000 |
| 2019 | $6,540 | $594,000 | $197,200 | $396,800 |
| 2018 | $6,352 | $554,300 | $176,100 | $378,200 |
| 2017 | $6,199 | $527,100 | $176,100 | $351,000 |
| 2016 | $5,677 | $476,300 | $176,100 | $300,200 |
| 2015 | $5,817 | $472,900 | $176,100 | $296,800 |
Source: Public Records
Map
Nearby Homes
- 12 Tara Rd
- 6 Allen Rd
- 11 Pulver Dr
- 21 Oak Leaf Way
- 43 Gedney Dr
- 26 Bartholomew Terrace
- 325 Den Quarry Rd
- 3 Margaret Rd
- 233 Bartholomew St
- 111 Den Quarry Rd
- 217 Cedar Brook Rd
- 38 Longview Way
- 54 Harris Rd
- 13 Ralph Rd
- 333 Lynnfield St
- 2 Anchor Rd
- 30 Longwood Rd
- 12 Mansfield St
- 9 Hermon Rd
- 15 York Terrace
Your Personal Tour Guide
Ask me questions while you tour the home.