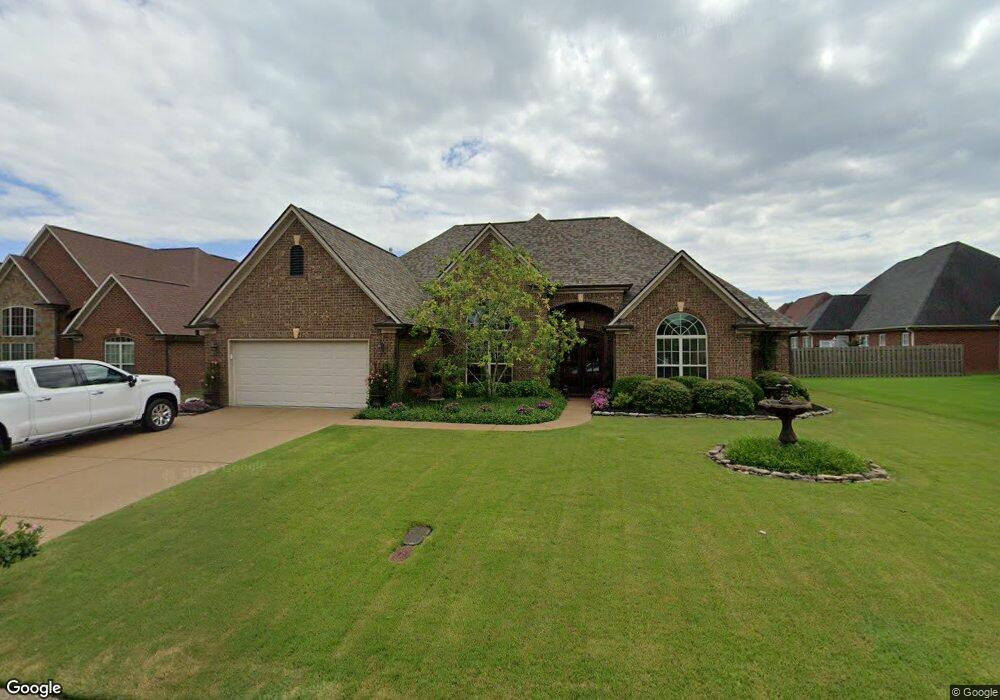
18 Joseph Cove Jackson, TN 38305
Estimated Value: $378,512 - $433,000
4
Beds
3
Baths
2,460
Sq Ft
$169/Sq Ft
Est. Value
About This Home
This home is located at 18 Joseph Cove, Jackson, TN 38305 and is currently estimated at $415,128, approximately $168 per square foot. 18 Joseph Cove is a home located in Madison County with nearby schools including Pope School, Northeast Middle School, and North Side High School.
Ownership History
Date
Name
Owned For
Owner Type
Purchase Details
Closed on
Jul 24, 2013
Sold by
Hubbard Donald A
Bought by
Zuerner Robert M and Zuerner Deborah L
Current Estimated Value
Home Financials for this Owner
Home Financials are based on the most recent Mortgage that was taken out on this home.
Original Mortgage
$207,580
Outstanding Balance
$154,144
Interest Rate
4.43%
Mortgage Type
Commercial
Estimated Equity
$260,984
Purchase Details
Closed on
Dec 16, 2011
Sold by
Diffee Construction Co Inc
Bought by
Hubbard Donald A and Chasteen David E
Home Financials for this Owner
Home Financials are based on the most recent Mortgage that was taken out on this home.
Original Mortgage
$178,415
Interest Rate
4.06%
Mortgage Type
Commercial
Create a Home Valuation Report for This Property
The Home Valuation Report is an in-depth analysis detailing your home's value as well as a comparison with similar homes in the area
Home Values in the Area
Average Home Value in this Area
Purchase History
| Date | Buyer | Sale Price | Title Company |
|---|---|---|---|
| Zuerner Robert M | $214,000 | -- | |
| Hubbard Donald A | $209,900 | -- |
Source: Public Records
Mortgage History
| Date | Status | Borrower | Loan Amount |
|---|---|---|---|
| Open | Zuerner Robert M | $207,580 | |
| Previous Owner | Hubbard Donald A | $178,415 |
Source: Public Records
Tax History Compared to Growth
Tax History
| Year | Tax Paid | Tax Assessment Tax Assessment Total Assessment is a certain percentage of the fair market value that is determined by local assessors to be the total taxable value of land and additions on the property. | Land | Improvement |
|---|---|---|---|---|
| 2024 | $1,460 | $77,900 | $8,750 | $69,150 |
| 2022 | $2,703 | $77,575 | $8,750 | $68,825 |
| 2021 | $2,335 | $54,150 | $7,375 | $46,775 |
| 2020 | $2,335 | $54,150 | $7,375 | $46,775 |
| 2019 | $2,335 | $54,150 | $7,375 | $46,775 |
| 2018 | $2,335 | $54,150 | $7,375 | $46,775 |
| 2017 | $2,251 | $51,000 | $7,375 | $43,625 |
| 2016 | $2,098 | $51,000 | $7,375 | $43,625 |
| 2015 | $2,097 | $51,000 | $7,375 | $43,625 |
| 2014 | $2,097 | $51,000 | $7,375 | $43,625 |
Source: Public Records
Map
Nearby Homes