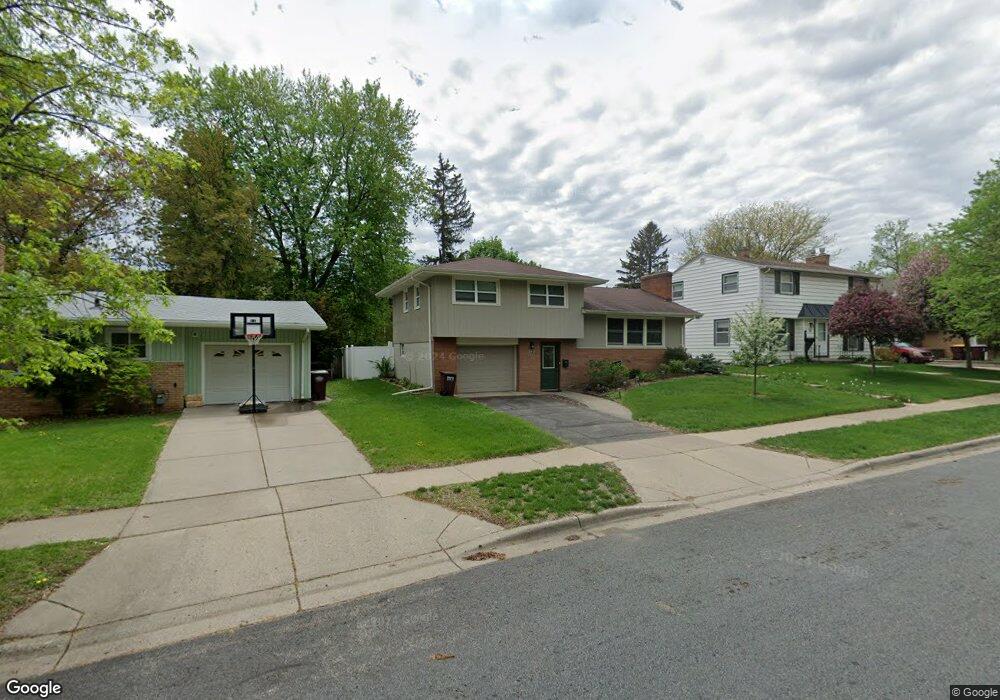
18 Logan Ave W Saint Paul, MN 55118
Estimated Value: $314,134 - $352,000
3
Beds
2
Baths
1,270
Sq Ft
$264/Sq Ft
Est. Value
About This Home
This home is located at 18 Logan Ave W, Saint Paul, MN 55118 and is currently estimated at $335,784, approximately $264 per square foot. 18 Logan Ave W is a home located in Dakota County with nearby schools including Moreland Arts & Health Sciences Magnet School, Heritage E-STEM Magnet School, and Two Rivers High School.
Ownership History
Date
Name
Owned For
Owner Type
Purchase Details
Closed on
Jul 30, 2014
Sold by
Capital City Construction & Remediation
Bought by
Johnson Jordan L
Current Estimated Value
Home Financials for this Owner
Home Financials are based on the most recent Mortgage that was taken out on this home.
Original Mortgage
$175,000
Outstanding Balance
$133,437
Interest Rate
4.11%
Mortgage Type
New Conventional
Estimated Equity
$202,347
Purchase Details
Closed on
Apr 9, 2014
Sold by
Beneficial Loan & Thrift Co
Bought by
Capital City Construction & Remediation
Home Financials for this Owner
Home Financials are based on the most recent Mortgage that was taken out on this home.
Original Mortgage
$100,000
Interest Rate
4.33%
Mortgage Type
Future Advance Clause Open End Mortgage
Purchase Details
Closed on
Sep 26, 2013
Sold by
Bernard Torchelle and Bernard Terrance Anthony
Bought by
Beneficial Loan & Thrift Co
Purchase Details
Closed on
Sep 13, 2002
Sold by
Bonine Willard N and Bonine Helen D
Bought by
Bernard Torchelle R
Create a Home Valuation Report for This Property
The Home Valuation Report is an in-depth analysis detailing your home's value as well as a comparison with similar homes in the area
Home Values in the Area
Average Home Value in this Area
Purchase History
| Date | Buyer | Sale Price | Title Company |
|---|---|---|---|
| Johnson Jordan L | $190,000 | Land Title Inc | |
| Capital City Construction & Remediation | $125,000 | First Financial Title Agency | |
| Beneficial Loan & Thrift Co | $130,750 | None Available | |
| Bernard Torchelle R | $169,900 | -- |
Source: Public Records
Mortgage History
| Date | Status | Borrower | Loan Amount |
|---|---|---|---|
| Open | Johnson Jordan L | $175,000 | |
| Previous Owner | Capital City Construction & Remediation | $100,000 |
Source: Public Records
Tax History Compared to Growth
Tax History
| Year | Tax Paid | Tax Assessment Tax Assessment Total Assessment is a certain percentage of the fair market value that is determined by local assessors to be the total taxable value of land and additions on the property. | Land | Improvement |
|---|---|---|---|---|
| 2024 | $3,172 | $256,300 | $78,100 | $178,200 |
| 2023 | $3,172 | $267,300 | $82,700 | $184,600 |
| 2022 | $3,132 | $261,000 | $82,400 | $178,600 |
| 2021 | $3,046 | $250,500 | $71,600 | $178,900 |
| 2020 | $2,872 | $242,600 | $68,200 | $174,400 |
| 2019 | $2,695 | $224,500 | $65,000 | $159,500 |
| 2018 | $2,390 | $203,500 | $60,700 | $142,800 |
| 2017 | $2,168 | $190,500 | $57,900 | $132,600 |
| 2016 | $2,081 | $169,300 | $52,600 | $116,700 |
| 2015 | $2,149 | $141,193 | $44,506 | $96,687 |
| 2014 | -- | $129,966 | $38,634 | $91,332 |
| 2013 | -- | $116,668 | $34,786 | $81,882 |
Source: Public Records
Map
Nearby Homes
- 1277 Hall Ave
- 69 Amelia Ave
- 100 Imperial Dr W Unit 204
- 111 Imperial Dr W Unit 102
- 1220 Stryker Ave
- 158 Southwind Ln
- 1450 Bidwell St Unit 110
- 1251 Macarthur Ave
- 150 Westchester Dr
- 1325 Calumet Ave
- 63 Langer Cir
- 69 Langer Cir
- 1252 Calumet Ave
- 1084 Hall Ave
- 1243 Oakdale Ave
- 1076 Humboldt Ave
- 191 Altman Ct
- 167 Butler Ave E
- 280 Edith Dr
- 242 Butler Ave W
- 18 Logan Ave W
- 24 Logan Ave W
- 12 Logan Ave W
- 12 12 Logan Ave W
- 15 Imperial Dr W
- 1328 Hall Ave
- 25 Imperial Dr W
- 15 Imperial Dr W
- 6 Logan Ave W
- 7 Imperial Dr W
- 29 Imperial Dr W
- 17 Logan Ave W
- 25 Logan Ave W
- 11 Logan Ave W
- 1 Imperial Dr E
- 2 Logan Ave W
- 1314 Hall Ave
- 5 Logan Ave W
- 40 Logan Ave W
- 40 40 Logan Ave W